
A frequent conversation among limited partner (LP) investors goes something like this:
LP #1: “How much of your private equity (PE) portfolio is invested in venture capital (VC)?”
LP #2: “None. We can’t access top-tier VC funds and if you can’t invest with these top-tier firms, the returns don’t justify the risk. Therefore, we avoid venture capital altogether (‘the Statement’).”
For the purposes of the Statement, a top-tier VC firm is one whose flagship fund has performed in the top 5 per cent of the US VC universe or is generally recognised as top-tier by the market. Current top-tier VC firms include Accel, Benchmark, Greylock Partners, Kleiner Perkins Caufield Byers, and Sequoia.
Not only is the Statement a commonly held belief among LPs, but also it’s something I have said numerous times. But the more I said the Statement, the more I wondered if this commonly held belief was true. What would happen if the underlying hypothesis for the Statement were tested against historical data?
Before proceeding, it’s important to highlight one obvious, but meaningful, fact: PE performance data is subject to change in the future, which has the potential to alter the conclusions from a study done today. For example, you might form a hypothesis that one of your US buyout funds ranks in the top quartile versus a relevant US buyout benchmark. But when you run the analysis using the most recent performance figures [i.e., net internal rate of return (IRR), ratio of distributions-to-paid in (DPI), and ratio of total value-to-paid in (TVPI)], you may discover that the fund ranks in the fourth quartile; therefore, your top quartile hypothesis would be rejected. However, fast forward two years and the fund’s performance may have improved due to a few investments that were realised significantly above the previous carrying values. When you benchmark the fund at that point, it would rank in the top quartile.
In this example, the results of the test changed with time and, ultimately, your hypothesis proved to be accurate. I highlight this point because it’s possible that VC data from years ago led to the conclusion that only top-tier VC funds outperform the top-quartile returns of all other PE strategies, but since that time, the data may have changed.
Reasons LPs stay away
Investing in VC funds is a complex task and many organisations appear to have thoughtful reasons for avoiding the strategy:
- Limited impact on returns for large LPs: Even a stellar 5-times net return from a small commitment to a VC fund would have minimal impact on performance for an LP with a multibillion-dollar PE portfolio.
- Lack of resources: There are hundreds of VC firms and some institutions have only one or two investment professionals to prosecute new LP commitments.
- Some LPs with resource constraints leverage funds-of-funds to obtain VC exposure (Cambridge Associates data shows VC funds-of-funds consistently perform above the US VC median TVPI).
- Lack of predictive metrics/lack of visibility on company development in early-stage companies: How many people could reliably predict that WebVan would go bust while Jet.com would be a homerun?
- Transparency/terms: Some organisations require economic or transparency terms that VCs won’t provide.
Another argument for avoiding VC if you can’t invest with the top-tier funds is dispersion of returns. Historical data shows that the dispersion of returns between top- and bottom-quartile VC funds is much wider than in top- and bottom-quartile buyout funds. Therefore, if you can’t access top-tier VC funds, you may not be appropriately compensated for the downside risk and would be better off sticking to buyout funds. The counterargument would be that instead of avoiding VC funds, LPs should be even more selective and diligent when committing capital to funds in this strategy. This topic is worth exploring in more detail, but would require a lengthy discussion that is outside the scope of this article.
Some necessary assumptions
Notwithstanding the constraints above, let’s test the Statement. Should LPs that can’t access top-tier VC funds avoid the strategy altogether?
In order to answer this question, I needed to make a few assumptions. First, I assumed that LPs that don’t invest in VC funds do invest in buyout funds. It’s rare to meet a PE investor who has meaningful exposure (5 per cent or more of total assets) to PE and doesn’t invest in either VC or buyout funds. Some invest in only one or the other, but rarely in neither. Second, I assumed that a top-tier VC fund is a fund that is in the top 5 per cent of the Cambridge Associates US VC benchmark in any given vintage year. This assumption is not perfect but directionally it should be accurate. If you accept these assumptions, please continue reading.
An LP that makes the Statement believes:
- It can’t access top-tier VC funds but can access top-tier buyout funds or at least top-quartile buyout funds
- Returns from top-quartile buyout funds consistently outperform top-quartile VC returns.
More top-quartile funds in VC than in buyout
Let’s see what the data shows. The chart below highlights the number of funds in the top 5 per cent and the top quartile for Cambridge US VC and US buyout benchmarks. As you can see, the number of funds in the top 5 per cent for both strategies is quite small (one to four funds each year since 2001). Therefore, I would say that it is equally difficult to access top-tier funds in both US VC and US buyout. When you examine the top-quartile data, there are more funds in both strategies, but look at the magnitude of the delta in number of funds. In every year since 1993, there have been more top-quartile US VC funds than top-quartile US buyout funds. In addition, there has been only one year since 1993 when there weren’t at least nine US VC funds in the top quartile (2009). On average, there have been 15 top-quartile US VC funds each year and only nine top-quartile US buyout funds. Even if you assume that three top-tier VC firms raise a fund every year, that still leaves 12 VC funds in the top quartile for LPs to try to access.
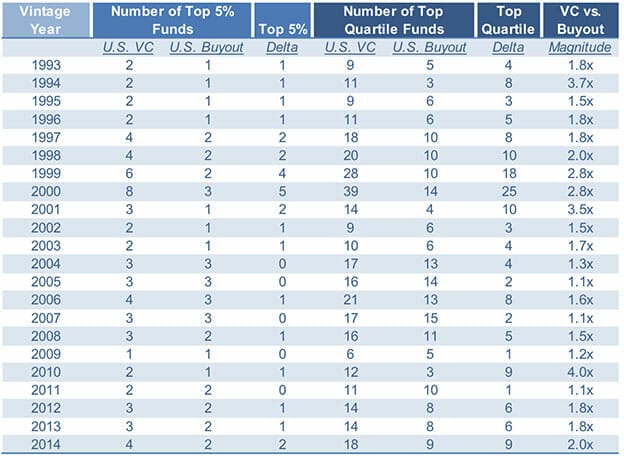
Source: Cambridge Associates, as of December 31, 2016 Note: the column on the far right (VC vs. Buyout Magnitude) is the number of VC funds divided by the number of buyout funds in that vintage year (i.e., 2008 vintage year has 23 VC funds and 11 buyout funds in the top quartile; 23/11 =2.1x
So there are a significant number of top-quartile US VC funds to access, but do they ever outperform US buyout funds? The chart below highlights the delta in net IRR between the top 5 per cent, top quartile, and median US VC funds and US buyout funds by vintage year. These figures represent the thresholds a fund would need to reach to achieve top 5 per cent, top quartile, and above median status in that vintage year. Top 5 per cent VC funds outperformed top 5 per cent buyout funds in 12 of 22 vintage years, top-quartile VC outperformed in 10 of 22 years, and median VC outperformed in six of 22 years. As you can see, the number of years where top-quartile US VC outperformed US buyout was nearly identical to the years when top 5 per cent US VC numbers outperformed. The magnitude of outperformance is significantly greater for top 5 per cent US VC funds, but there is still material outperformance for top-quartile US VC funds.

Source: Cambridge Associates, as at December 31, 2016 Note: (negative) means VC underperformed buyout and positive means VC outperformed buyout. The top 5% and top quartile net IRRs shown are thresholds to reach top 5% and top quartile status in a given vintage year. These are not actual pooled IRRs of the top 5% and 25% funds.
Based on this data, our conclusion is that top-quartile US venture capital has the ability to outperform top-quartile US buyout, depending on the year. Even if you can’t access the very top-tier VC funds, you still have the potential to invest in US VC funds that could outperform US buyout funds and generate reasonable absolute returns. This conclusion is consistent with findings from a Cambridge Associates study related to company-level returns in the venture industry and how 60-plus firms accounted for value creation in the top 100 investments each year.
This conclusion raises numerous questions: How do the results change if you parse the data by stage (i.e., early vs. late stage)? Are US buyout funds truly less risky than US VC funds? Why has the delta in returns between top-quartile US VC and US buyout funds compressed over the last 14-15 years? These are all great questions but, for now, all I can say is that the top-tier VC fund myth has been busted. You should always strive to access top-tier funds in any strategy, but the data doesn’t support LPs avoiding US VC simply because a handful of firms are inaccessible.
Wes Bradle is senior portfolio manager at the State Board of Administration of Florida.
Disclaimer: The views and opinions expressed in this article are those of the author and do not necessarily reflect the official policy or position of his employer, the State Board of Administration of Florida.


Leave a Comment
You must be logged in to post a comment.
Login