

Recent research by The Conexus Institute identifies significant dispersion in the operating environment for Australia’s superannuation funds. Here they consider the impact on fund investment models including internalisation, private assets and offshore investment teams.
Dispersion is increasing in the operating environment for Australian superannuation funds, with size and flows the most obvious differentiators. This motivates fund-specific investment models, especially in the areas of internalisation, private assets and development of offshore investment teams.
The Conexus Institute’s recently released 2024 edition of its State of Super Research Booklet, provides insights into the state of the Australian super fund sector using data for funds that are regulated by the Australian Prudential Regulation Authority (APRA). In this article we draw out some key insights and consider how they impact fund-specific investment models.
Dynamics of the Australian super industry
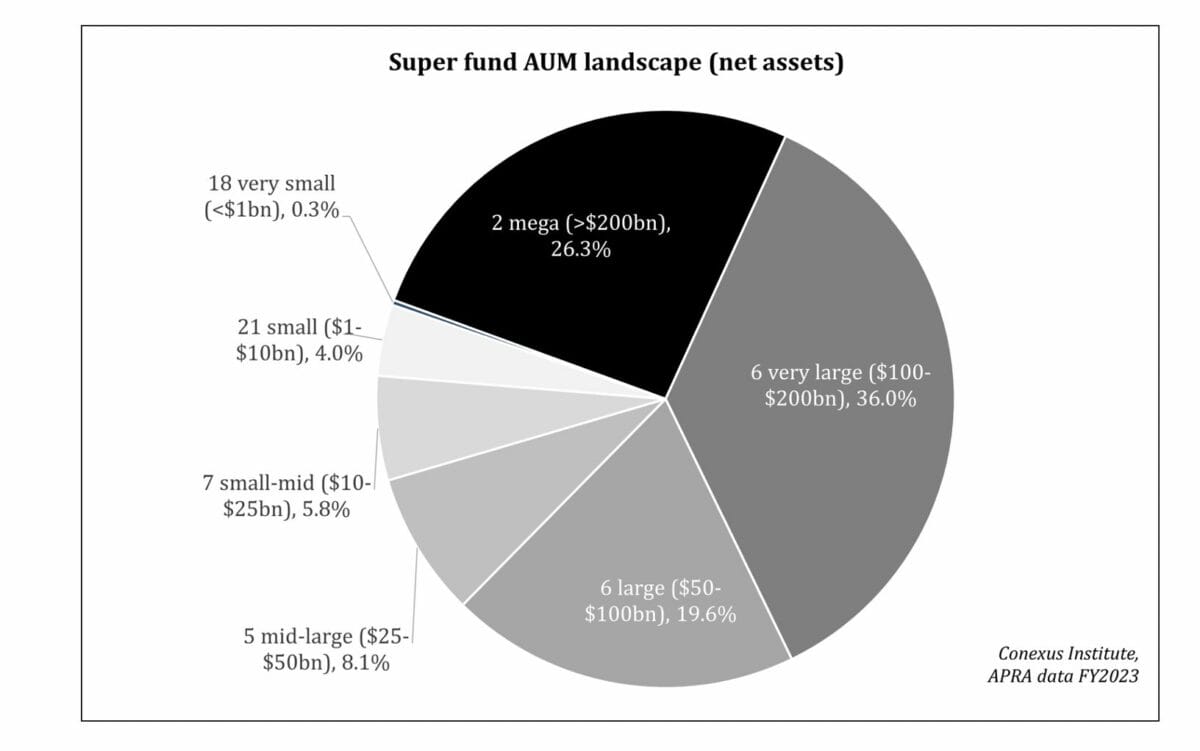
There are around 50 super funds with assets exceeding A$1 billion, with the largest at June 2023, AustralianSuper, approaching A$300 billion ($200 billion). The diagram below identifies that the 14 largest funds (the ‘big 14’) manage about 82 per cent of industry assets. There exists sizable dispersion in fund size, and the level of dispersion is only increasing. The market share of the largest super funds continues to increase as the system grows overall, making for some sizeable funds.
Fund flows is another dimension where even greater dispersion is evident. Flows for APRA-regulated funds, which account for contributions, pension payments and member switching (choice-of-fund) activity, netted out at a positive 2.4 per cent of assets in FY2023. Note this captures member-related flows, and does not account for investment income and returns. However, closer examination reveals that only two-thirds of super funds are experiencing positive net flows, meaning that one-third is experiencing outflows.
Below we combine these size and growth numbers into a single chart to create a summary view of the dynamics of the Australian super fund industry. Each dot point represents a super fund, with size appearing on the horizontal axis and net flows on the vertical axis.
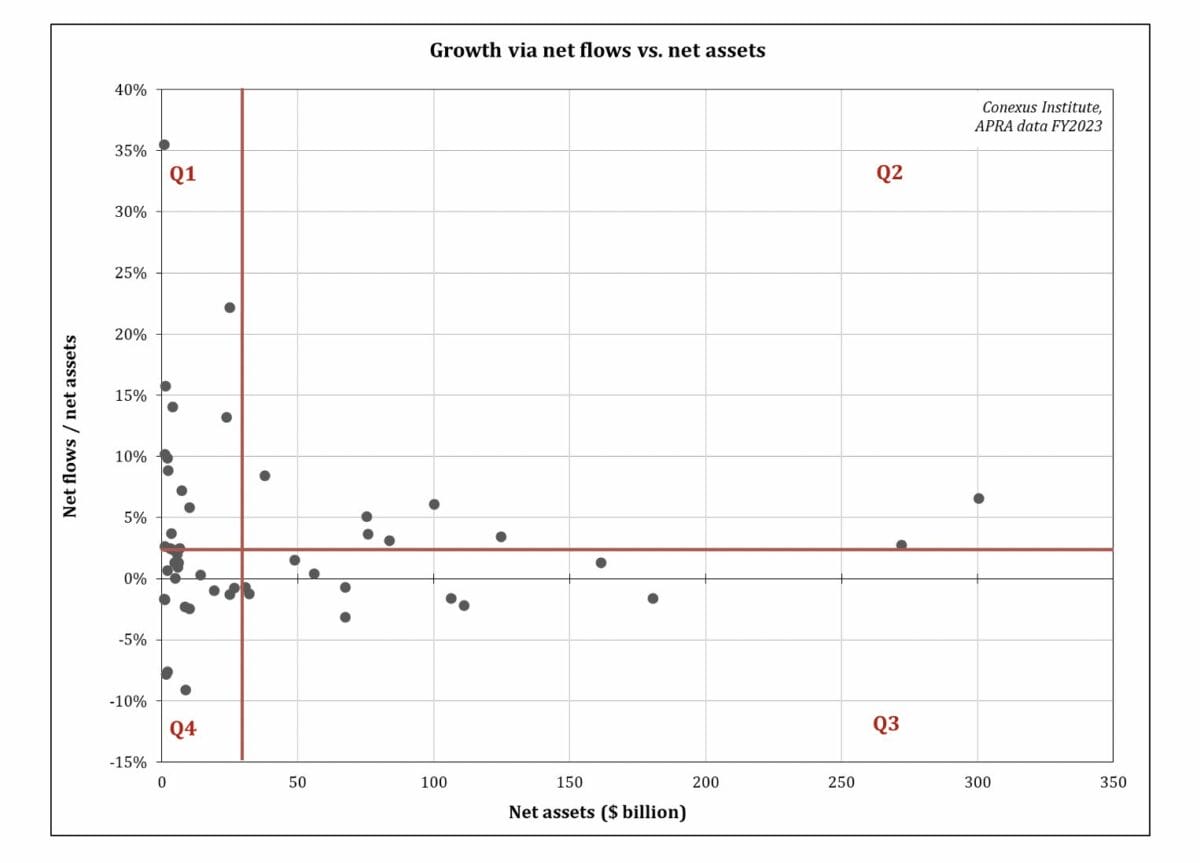
The horizontal red line represents the 2.4 per cent average net flow rate. The vertical red line of A$30 billion reflects a number that APRA has used as an indicator of reasonable scale. Below we briefly reflect on each quadrant to explain the situation faced by super funds:
- Quadrant 1 includes small but fast growing super funds. Our research identifies that often these high growth levels moderate over time, sometimes before these super funds reach good scale.
- Quadrant 2 is where most super funds would like to be: good scale and experiencing above industry average growth rates. Our research identifies that this quadrant is sticky for some funds but elusive for others, with no funds managing to shift into this quadrant over the last year.
- Quadrant 3 contains super funds that have good scale but are experiencing a rate of growth below the industry average and in some cases negative. The challenge for these super funds is to successfully develop and implement a growth strategy.
- Quadrant 4 super funds face the difficult situation of being below scale and experiencing below industry average growth rates. The regulator is likely exploring the sustainability of super funds in this quadrant. Many will be looking to merge with other funds.
Evolution of investment models
Given the disperse dynamics across the Australian super industry, it makes sense that we observe super funds evolving their investment model to one that is appropriate given their situation.
Amongst the largest super funds we are seeing increasingly sophisticated investment activities. Some of the major investment management trends in Australia include internalisation, direct participation in the private asset space, and establishment of offshore investment capabilities. AustralianSuper, for instance, manages over 50 per cent of assets internally and has offices in Beijing, London and New York. Last year Aware Super announced an international expansion of its investment function, the first step of which was the establishment of its London office.
Internalisation of asset management among large super funds is not a new characteristic of the Australian super fund industry. However, the breadth and sophistication of internalised strategies is increasing, as are the size of internal investment teams. Examples of the degree of sophistication include active management of public markets, more direct involvement in private transactions, and greater focus on cash and liquidity management.
The increasing sophistication of private asset activities among many large super funds is notable in this regard, with many of the large super funds having sizable private asset transaction teams, allowing funds to take on deals in a syndicated model (with asset managers and/or other asset owners) or on a standalone basis.
Finally, some of the biggest super funds are establishing large offshore investment teams to support activities in both public and private assets. A broad range of arguments are offered in support for creation of offshore investment teams, including proximity to private asset deal flow, improved ability to analyse and collaborate over private assets and more effective time zones for trading. There are also strong human resource arguments such as access to a larger investment talent pool and increased diversity.
Not all funds are following these trends in investment model evolution for a range of reasons. Some logically flow from the size and scale situations faced by the fund. Others may be more legacy-related.
Scale is a sizable barrier for smaller super funds when considering their investment model, in particular with regard to internalisation and private assets. These areas require an uplift in the sophistication of the investment model and development in a range of areas including investment teams, reporting, risk, compliance, and governance. For many smaller funds, the required uplift in capabilities may prove too costly relative to the potential benefits.
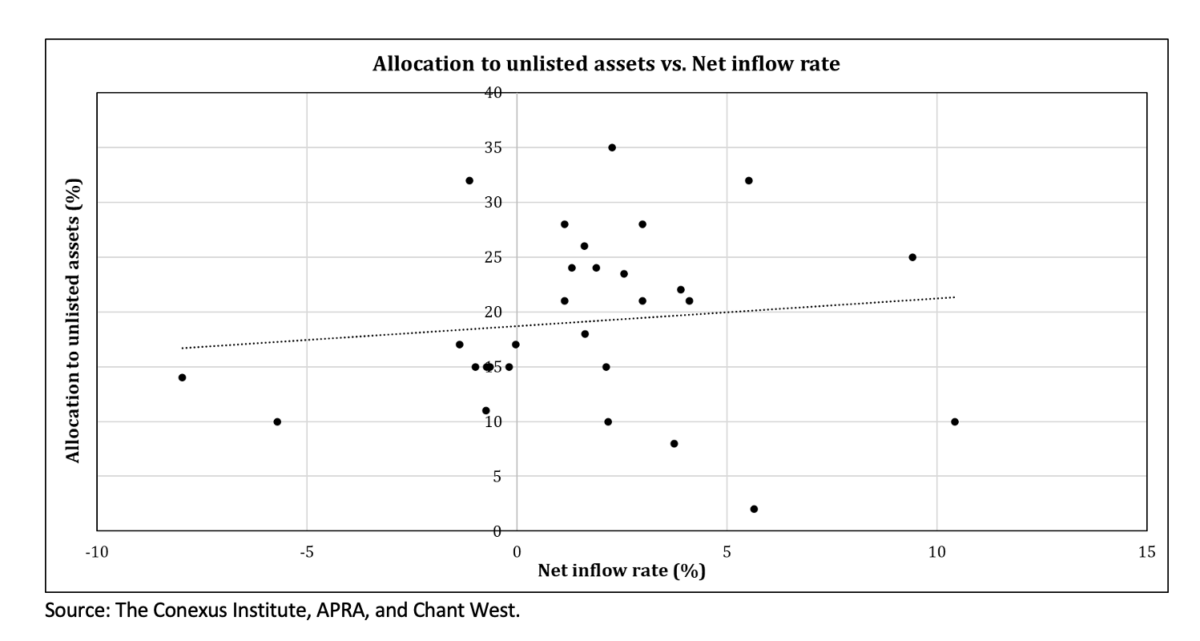
The flows experienced by a super fund can also be an input into a fund’s investment model. It is rational to assume that funds that are experiencing outflows have less capacity to allocate to illiquid assets. However, our research suggests that flows are only one driver. The diagram below comparing super fund allocations to illiquid assets against flow rates reveals there is some relationship, but also much variation around the line of best fit.
Legacy reasons also help explain why some super funds are not evolving their investment models as much as others. One influence is the significant work associated with fund mergers. Flow-on activities from a merger – such as team integration, product consolidation, systems development and investment philosophy and strategy harmonisation – can last years. There can be little opportunity for other initiatives, especially those expanding the scope of investment activities.
Finally, evolving an investment model does not guarantee positive outcomes. Some super fund boards and their chief investment officers may take a more cautious view of the net benefits of implementing a range of activities that entail greater sophistication. There are many risks related to implementation, operational, governance and cultural challenges. For instance, a few large super funds continue to use a substantially outsourced model, including Australian Retirement Trust and Hostplus.
The Conexus Institute is a retirement-focused research think tank philanthropically funded by Conexus Financial, publisher of Top1000funds.com.
David Bell is executive director and Geoff Warren is research fellow at The Conexus Institute.


Leave a Comment
You must be logged in to post a comment.
Login