

Analysis of institutional investor private equity allocations shows the differences in implementation styles and related costs are a key driver of a wide dispersion in private equity results. Researchers at CEM Benchmarking recommend smaller investors should consider investing in small cap equity rather than PE, and larger investors should consider internal or co-investment options. Regardless, costs matter, a lot, in PE.
Do you have what it takes to be a top-quartile private equity investor? Research from CEM Benchmarking sheds light on why this is an important question. Long-term private equity (PE) portfolio results achieved by institutional investors were very dispersed. From top to bottom, relative to a small cap public equity benchmark, 10-year net value added (NVA), for the period ending December 31, 2018, ranged from -6 per cent to +6 per cent. Top quartile was good. Bottom quartile was not.
NVA results were strongly associated with implementation style choices:
- Low cost internal and co-investment outperformed
- Limited Partnerships (LPs) underperformed some-what
- High cost Fund-of-Funds underperformed by a wide margin
Private equity and the CEM database
The CEM database includes over 8,000 investor data sets spanning 27 years. In 2018, 325 institutional investors, mostly pension funds, held $10 trillion total assets under management (AUM). Key PE portfolio data captured includes holdings, net returns, benchmarks and costs. PE allocations have tripled over the past 25 years, from 1.4 per cent to 4.5 per cent of investor AUM. In 2018, 241 investors held $679 billion of PE.
Long term (1994 -2018), 65 per cent of investors increased their PE allocations in what seems a broad move to diversify away from classic 60/40 portfolios. Generally, they reduced public equity and fixed income holdings while increasing hedge fund, real asset and PE.
More recently (2013 – 2018), 37 per cent of investors increased their allocation to PE while 18 per cent decreased their allocation. The latter, who were predominately smaller corporate pension funds, also decreased their public equity holdings and increased their fixed income and real asset holdings. This pattern is suggestive of de-risking strategies.
Private equity implementation styles
The PE implementation style approaches used by investors have a huge impact on their long-term PE results. Exhibit 1 summarises key implementation style data.
Exhibit 1: Selected Private Equity Implementation Style Data from the CEM Global Database (2018)
| Implementation Style | Investors using style | Investors exclusively using this style | Total PE AUM | Median costs* |
| Fund of Funds | 150 | 52 | $97.5 bn | 488 bps |
| Limited Partnerships | 186 | 75 | $453.7 bn | 331 bps |
| Co-investments | 43 | 0 | $37.2 bn | 38 bps |
| Internal | 29 | 0 | $91.1 bn | 44 bps |
* Costs expressed relative to NAV. These costs include base manager fees, carried interest and internal costs but exclude transaction costs.
Limited partnerships are investments made with General Partners (GPs). LPs were the predominant implementation style, used by 77 per cent of all PE investors, and accounting for 67 per cent of total PE AUM.
Seventy-five investors used LPs exclusively. All investors with internal and co-investment programs also used LPs. The median LP cost in 2018 was 331 basis points.
Fund of funds are vehicles that invest primarily in LPs, creating a two-tier fee structure. Fund of fund investing is a common approach for smaller investors and is often the ‘starter’ approach to PE. In 2018, 52 investors used it exclusively to implement their PE programs. Their average PE AUM was only $300 million. It is a very expensive approach – the median cost for 2018 was 488 basis points. Over 2013-2018 fund of fund usage declined, as 33 per cent of PE fund of fund investors reduced their allocations.
Internal investments are made directly into operating companies by investor staff. Canadian investors are over-represented in this group. Although used by only 29 investors, internal represented 14 per cent of PE AUM. These investors are large, with median total AUM of $83 billion. Their average PE portfolio was $11 billion, including $3 billion of internal. At 44 basis points, median internal costs were much lower than both LPs and fund of funds.
Co-investments are minority investments directly into operating companies alongside a GP with whom an investor invests as an LP. 43 investors reported a total of $36 billion of co-investment AUM in 2018. At 38 basis points, co-investment programs have the lowest reported costs. Co-investment usage has grown substantially, 52 per cent of these investors increased their co-investment allocation between 2013 and 2018.
Private equity performance
Benchmarks used to evaluate performance for any asset class should meet three key criteria:
- An accessible alternative available at low cost
- Similar risk profile to the actual portfolio
- High correlation with actual portfolio returns over time
Unfortunately, the PE benchmarks used by many investors don’t meet these criteria and create more noise than information. Performance evaluation issues include differences in benchmarks types, as well as the use of lags and inclusion of un-investable premiums. Therefore, to enable fairer, ‘level-playing-field’ comparisons, CEM applies a custom-lagged, regional blend of small cap equity indices. This benchmark meets the criteria above and is much better than most investor-reported PE benchmarks.
Exhibit 2 shows the wide range of PE portfolio NVA achieved by investors with consecutive years of PE data for the 10 and 20-year periods ending 2018. Some investors did exceptionally well. Top quartile NVA was 2.0 per cent over 20 years and 0.8 per cent over 10 years. Top decile was 2.8 per cent and 2.1 per cent respectively for the same time periods. Unfortunately, the story is very different for some investors. Bottom quartile NVA was -2.0 per cent over 20 years and -2.2 per cent over 10 years. Bottom decile was -2.9 per cent and -3.7 per cent respectively for the same time periods.
Exhibit 2: Dispersion of Private Equity Net Value Added in the CEM Global Database
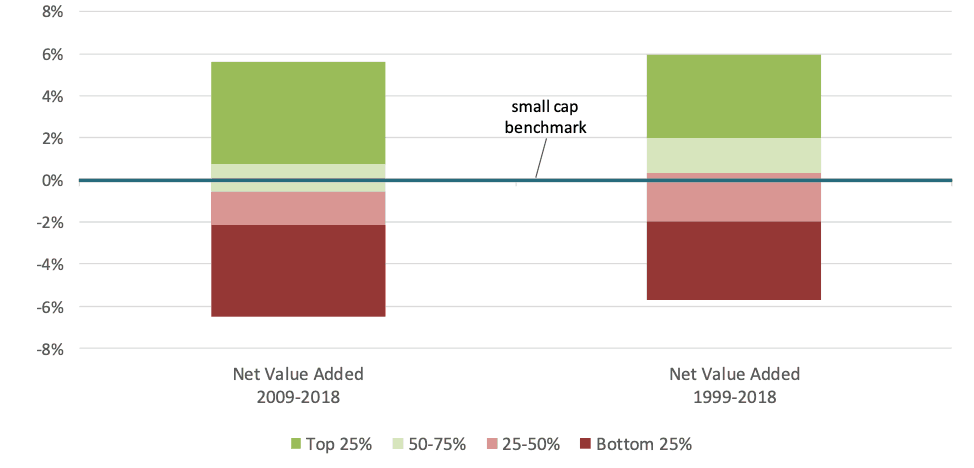

*Includes only investors with consecutive private equity data for each time period. Net value added shown versus the lagged small cap benchmark.
Isolating the implementation styles that comprise PE portfolios adds important insights about this wide dispersion.
Exhibit 3 shows these long-term NVA results. Internal and co-investment are combined because their costs are similar but very different from both LPs and fund of funds. Average internal plus co-investment NVA was best at 1.4 per cent, followed by LPs at -0.7 per cent, while fund of funds trailed considerably at -2.3 per cent. Although not described here, NVA was also widely dispersed within implementation styles.
Exhibit 3: Average PE NVA by Implementation Style in the CEM Global Database (1996 -2018)
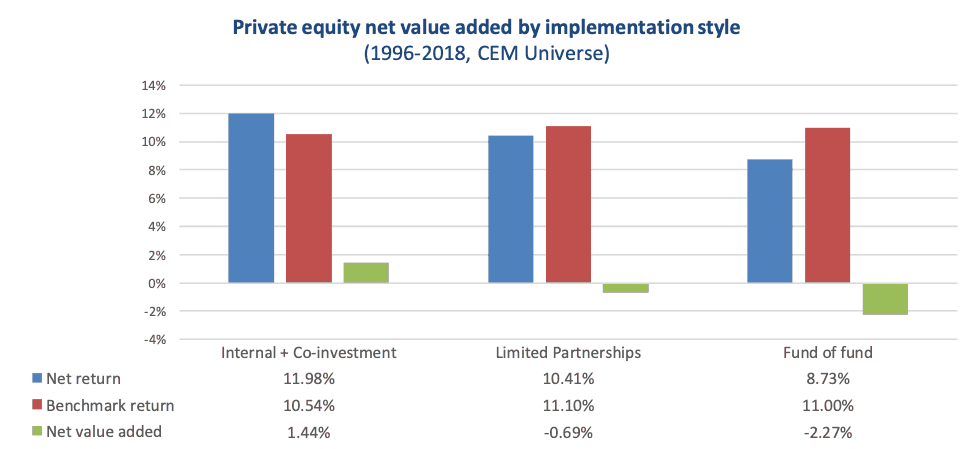
* Research Exhibits 3 and 4 are based on a recent PE study by CEM Benchmarking and are based on 2,200 fund of fund observations,
1400 LP observations and almost 300 internal and co-investment observations. NVA shown is versus a lagged small cap benchmark.
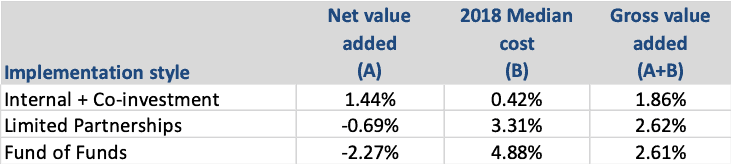
Adding back implementation style costs to its respective NVA provides an estimate of value added before costs (GVA). Exhibit 4 shows these results.
What stands out is that all implementation styles did much better than the small cap benchmark before considering costs. In fact, the highest cost fund of funds style outperformed the lowest cost combination of internal plus co-investment by 75 basis points gross of costs.
Net of costs that differential swings dramatically to 371 basis points in favor of internal and co-investment.
Costs matter.
Exhibit 4: Net and Gross PE NVA in the CEM Global Database
Implications for investors
Relative to an investable small cap equity benchmark, PE has been a good asset class for many investors but a poor asset class for many others. Empirical evidence points clearly to differences in implementation style usage and related costs as a key driver of this wide dispersion.
Implications for smaller investors:
- High cost fund of fund structures are often used by smaller investors to implement PE programs. The most probable outcome is substantive underperformance.
- Consider investing in small cap equity rather than PE.
Implications for larger investors:
- Better PE performance has historically come from more lower cost internal and co-investment. Large investors have the scale to use internal and the clout to partner with their GPs to secure co-investment opportunities.
- Adding internal is a major change that has serious implications. Prerequisites include quality governance, long-term organisational commitment and aligned culture, talent and compensation.
Implications for all investors:
Costs matter, but a lower cost implementation approach does not guarantee superior PE results; nor does a higher cost approach guarantee poor results.
NVA is very dispersed across all investors and within implementation styles.
LP-only PE investors have generated top-quartile, long-term results. Even some fund of fund programs have produced good results. Other factors matter, including decision and risk management processes, organisational talent, and relationships with leading GPs.
Mike Heale is a principal and Janjaap Weeda is a senior analyst at CEM Benchmarking.


Leave a Comment
You must be logged in to post a comment.
Login