

Global asset owners have made significant advancements in the transparency of disclosures with the industry, showing unprecedented alignment with best practices in performance, responsible investing and governance disclosures.
However, transparency of cost disclosures continues to be a pain point, according to the 2025 Global Pension Transparency Benchmark.
A joint initiative between Top1000funds.com and CEM Benchmarking, the 2025 edition of the GPTB marks the final instalment of a five-year project which was established to showcase best practice in the industry and provide a self-improvement framework for fiduciary investors.
Each fund and country analysed is given an overall transparency score out of 100, which is informed by their reporting practices across four dimensions: cost, governance, performance and responsible investing.
This year’s results are a clear indication of the steps that global pension funds have taken to enhance trust and improve reporting practices. In 2025, the average transparency score for funds is 65, compared to 63 last year and 60 in 2023.
More funds continued to enhance the quality of their public reporting, with 61 per cent lifting their scores – slightly lower than the 72 per cent that did so last year.
Responsible investing disclosures continue to be the area with the most measurable change, with the average country score of 71 in 2025, which represents a significant jump from 47 in the first edition of the GPTB in 2021.
Eight funds received a perfect score in at least one factor, with Norway’s Government Pension Fund Global scoring 100 in all four and taking the top spot in the fund rankings for the third year in a row.
The average country score of the performance factor rose to 66 (from 64 last year), while the average governance score edged up to 75 (from 74 in 2024).
But funds have failed to make inroads on cost reporting. Over the five years of the GPTB project, the average country score actually regressed from 51 in 2021 to 49 in 2025.
Cost
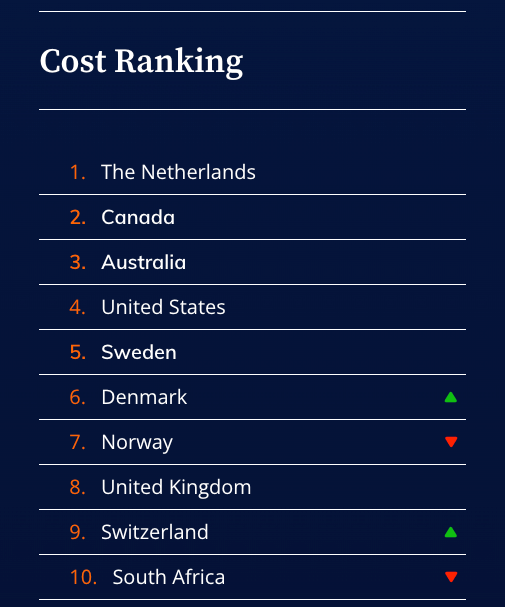 Pension funds were scored on cost across 28 questions in three aspects common to all, including annual and financial report disclosures, asset class disclosures and the completeness of external management fees, and one aspect focused on member service.
Year on year, the average country score on the cost factor did not see any improvements (49 points). There is also a great dispersion of results with individual fund scores ranging from 11 to 100.
The Netherlands continues to demonstrate best-in-class cost reporting with the highest score of 90, while Denmark and Switzerland are the two countries among the top 10 whose rankings improved.
The benchmark notes that there are barriers to comparability in reviewing costs across the globe, due to differences in tax treatment, organisation/plan types, and accounting and regulatory standards. The review is focused on the material areas common to most funds.
Governance
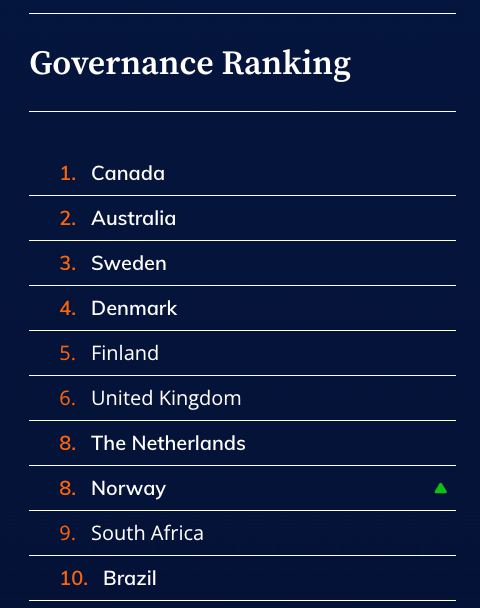 Organisations were evaluated across 35 questions across four components in governance, which included the disclosure of governance structure and mission, board qualification, compensation and team structure, and organisational strategy.
Three of the six funds that achieved a perfect score in this category are Canadian investors. Canada is also the country with the highest governance reporting score of 99.
Norway was the only country among the top 10 overall with improved rankings in governance.
The benchmark report notes that governance scores were most closely correlated with the overall score and proposes that as good governance produces positive results, it creates greater incentives to be transparent with stakeholders.
Governance also has a demonstrated relationship with responsible investing, as the report notes that good governance could prompt funds to move beyond purely managing assets and towards creating social and environmental benefits.
Performance
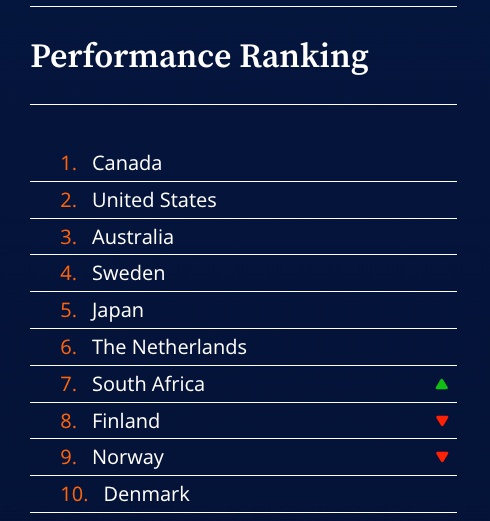 Performance scores were based upon 44 questions across seven components that were common to all funds, and two (member services and funded status) that were only applicable for some asset owners.
The benchmark report notes that components were re-weighted to accommodate what was not applicable, so that each individual fund was scored out of 100.
Canada again claimed the top spot in performance reporting disclosures with a country average score of 92, followed by the US and Australia. South Africa was the only nation in the top 10 to lift its ranking, improving from a score of 61 in 2024 to 66 in 2025.
The report notes that disclosures of the current year and at the total fund or investment option level are generally comprehensive, however reporting on longer time periods and asset class results tends to be minimal or missing. Some funds disclose intermediate (for example, three to seven years) performance figures.
Responsible investing
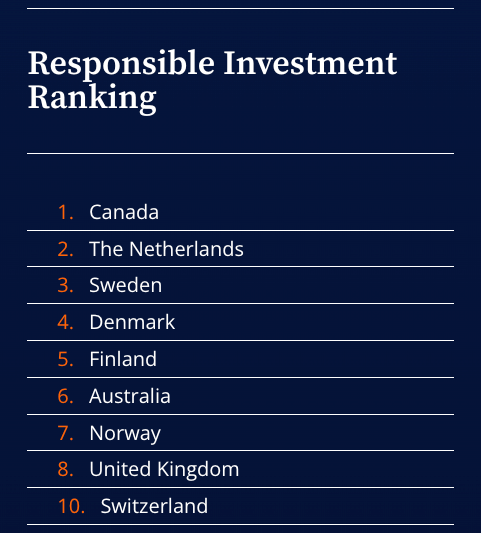 Assessment around responsible investing is the most comprehensive with 47 questions across three major components. The average country score was 71 in 2025, up from 67 in 2024 and 47 five years ago. The massive uplift is a sign that the responsible investing trend remained resilient despite headwinds facing ESG.
Canada retained the top spot in the factor ranking with an average score of 96.
Although sitting outside the top 10 leader board, three Latin American nations – Mexico, Chile and Brazil – improved their rankings, all with a score uplift of more than five points.
The Nordic countries – Sweden, Denmark, Finland, and Norway – continued to hold high standards as a region with responsible investment reporting, with all countries scoring higher than the factor average.
The benchmark report highlights that responsible investing continues to have the greatest dispersion of scores, reflecting that countries are at different stages of implementing responsible investing within their investing framework. Average country scores ranged from 0 to 100.
Over the years, CEM Benchmarking product manager Edsart Heuberger says the GPTB benefited from valuable input from funds that were measured, allowing it to evolve. Of the top 10 transparency leaders, eight engaged closely with the project, filling in measurement gaps of the research and asking for examples of best practices.
The real force that will drive change within an organisation almost always comes from the internal leadership team, rather than from external forces such as regulators, he says.
“My tip is this is a framework that is robust, remains relevant… if funds haven’t made the improvements, the roadmap is still in the public domain.
“The goal was to take public reporting to a much higher level, and given all those stats, I think we’ve accomplished that.”


Leave a Comment
You must be logged in to post a comment.
Login