Best funds for transparency revealed: where did your fund rank?

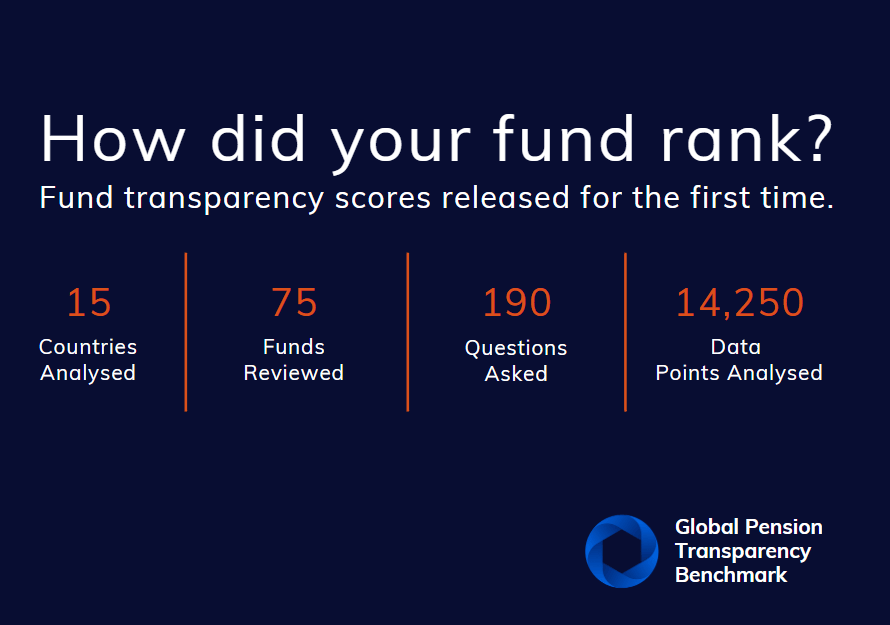
The Global Pension Transparency Benchmark has revealed the top ranking funds globally for transparency of disclosure across cost, governance, performance and responsible investment. Click here for the results of 75 funds across 15 countries.

The GPTB, a collaboration between Top1000funds.com and CEM Benchmarking, measures the transparency of disclosures of 15 pension systems across the four value generating measures, with the country scores amassed by looking at the largest five asset owners in each country. Now the scores of these underlying asset owners have been revealed for the first time.

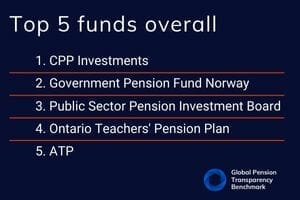
CPP Investments has emerged with the best score overall followed by the Government Pension Fund of Norway, the world’s largest sovereign wealth fund.

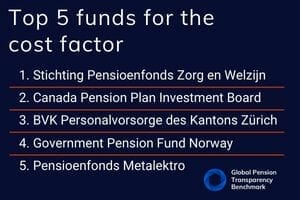
For cost disclosures the large Dutch fund, PFZW, ranked number one followed by CPP Investments.

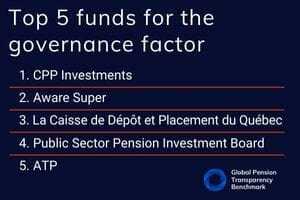
CPP Investments also took the top honour for transparency of disclosure related to governance, followed by Australia’s Aware Super.

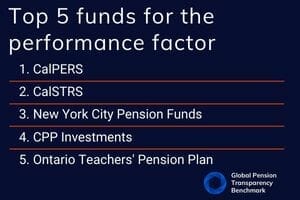
The two top funds for transparency related to performance were the large Californian funds CalPERS and CalSTRS.

Sponsored Content

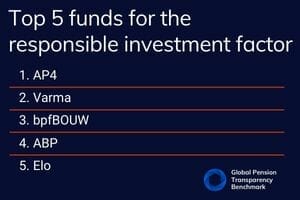
And for responsible investment, funds in Europe dominated with Sweden’s AP4 taking the top spot followed by Varma.

It is the second year that the GPTB has ranked countries on the transparency of disclosure related to the four factors of cost, governance, performance and responsible investment. Both years Canada topped the country list overall.

Canada’s dominance is demonstrated by the fund five’s analysed in that country all featuring in the top 11 funds overall. They were CPP Investments (1st), PSP Invesments (3rd), Ontario Teachers Pension Plan (4th), BCI (8th) and CDPQ (11th).

Click here for an interactive table for all countries and all funds and click here for analysis of the individual funds, their rankings and related stories.


Leave a Comment

CPP Investments, NBIM reflect on lessons from a 5-year transparency journey

CPP Investments, NBIM reflect on lessons from a 5-year transparency journey

The Global Pension Transparency Benchmark has been a driving force in improved transparency of disclosures and reporting among global asset owners. As the project comes to its close after five years, two leading funds reflect on why transparency has been a clear focus for their organisations. 

Sort content by

GPTB highlights transparency gaps

The Global Pension Transparency Benchmark has revealed the need for serious improvement in pension transparency across the globe.

Benchmark will help build trust

Transparency is an important link in improving pension delivery, and the Global Pension Transparency Benchmark will help lift transparency standards and ultimately trust in pension institutions, according to its advisory board.

Pension transparency needs a benchmark

A new Global Pension Transparency Benchmark – the first formal collaboration between Top1000funds.com and CEM Benchmarking - will launch in February 2021 ranking countries, via their underlying pension funds, on four factors: governance and organization; performance; costs; and responsible investing.

Asset owners report half of all costs

Asset owners are reporting only half of their true total costs according to analysis by CEM Benchmarking exclusively for Top1000funds.com. This means tens of billions of dollars across the industry is not being reported. The authors look at case studies and make suggestions for industry best practice.

Canadians more complex than first glance

The Canadian model, revered world over for its supreme pension management, is not low cost despite that being one of its oft-described traits. New research by CEM Benchmarking and McGill University shows that these funds are cost efficient, rather than being low cost. Their aim is to be high net performers, not low cost.

What past market crashes teach us

Looking back at the portfolios of large institutional investors during and after the dot.com crash and the GFC, CEM Benchmarking, reveals commonality in the portfolios that thrived. For both events the top quartile returns were more than 2 per cent higher than the bottom quartile. Analysing the asset allocation and behaviour of investors showed two clear themes: top quartile performers had more defensive allocations pre-crash; and rebalancing is a tailwind for performance.