

As economies around the world grind to a halt in reaction to the COVID-19 crisis, equity markets have predictably tumbled. The crash has been rapid and while there are inklings of a recovery on the horizon, it is fair to say that nobody knows when it will truly come or what it will look like. Market crashes have happened before, and in lieu of a model for how portfolios recover from the current crisis, it is a useful exercise to look back and see how institutional investors performed over other challenging periods.
The CEM Benchmarking database provides a look back at both the slow-burn dot-com crash between 2000-2004 and the Global Financial Crisis (GFC) which defined 2007-2010.
The time periods capture both the crash and recovery of each event, and the dataset represents over 220 US pension funds with average holdings of $12.1 billion.
The investors were separated into quartiles based on their overall performance through each event. For both events, top quartile returns were more than 2 per cent higher than bottom quartile returns.
Analysing differences in asset allocation between the two groups revealed three drivers of return differences. First, having a defensive allocation going into the crash was a common factor in the best performing portfolios. Second, these investors rebalanced to a significant degree over both events. Third, top quartile performers in the dot-com crash actually ‘bought the dip’ and increased their equity allocations beyond their pre-crash levels. In contrast, in the GFC there was an acceleration of trends that helped going into the crash.
The Dot-Com Crash, 2000-2004
Top quartile performers (the solid lines in the graph below) in the dot-com bubble had defensive allocations going into the crash but transitioned to more aggressive asset mixes coming out of the recovery, capturing more of the upside than their allocation at the start would have suggested.
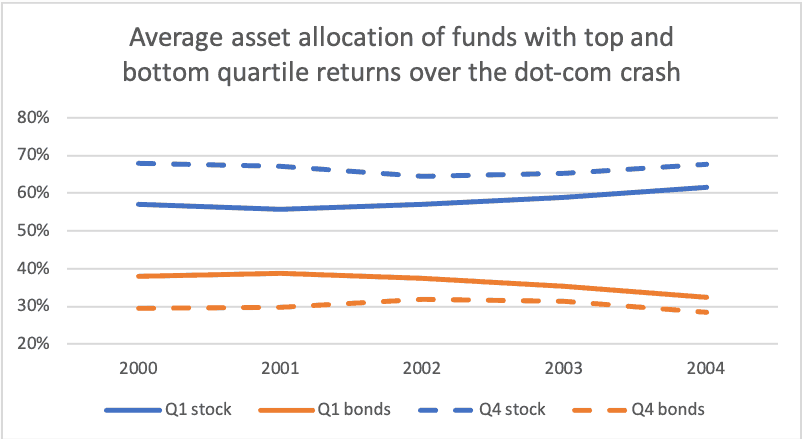
During the crash, stock prices tumbled while bonds outperformed, especially long duration bonds. In the recovery, stocks outperformed.
As you would expect, funds with high stock-to-bond ratios crashed the hardest and recovered the most. Conversely, investors with higher bond allocations (long bonds in particular) weathered the crash well but lost out on some of the upside during the recovery.
Top quartile funds over the three-year period had higher initial bond allocations: 38 per cent bonds in 2000 versus 30 per cent for the bottom quartile performers. The downside protection during the initial crash was more valuable than having more upside capture in the initial years of the recovery. By the end of the recovery however, top quartile funds sold bonds down to 32 per cent of their portfolios, while bottom quartile funds held steady at 28 per cent.
The fact that both top and bottom quartile investors’ asset allocations either trended towards stock or stayed level suggests that funds rebalanced through the market event.
If they had not rebalanced, the stock allocation for the average bottom quartile investor would have fallen from 67 to 54 per cent between 2001 and 2002 due to market return, rather than to 65 per cent.
The 65 per cent allocation to stocks demonstrates a high level of rebalancing. This degree of rebalancing was expected given that the large institutional investors in the dataset tend to be more disciplined in their investment approach. It was certainly a tailwind for performance, as rebalancing to stock helped in the ensuing market rally.
Over the entire five-year period, top quartile performers did more than merely rebalance – they bought back into the stock market at a discount. These funds increased their stock holdings to levels above their pre-crash allocation, which resulted in higher upside than would have been expected from their starting allocation.
The Global Financial Crisis, 2007-2009
Top quartile performers in the GFC also had defensive allocations in the crash. Investor portfolios that performed the best were heavier on long bonds initially and continued to allocate towards less risky assets coming out of the recovery.
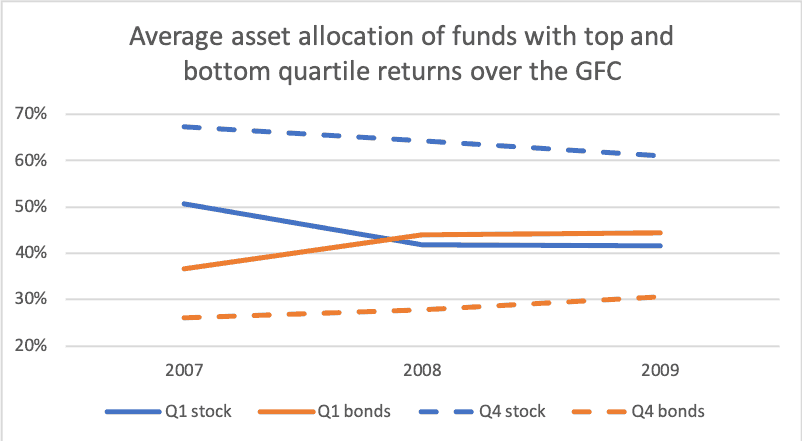
Similar to the best performers in the dot-com crash, top quartile funds had higher bond allocations on average compared to the bottom quartile funds. Top quartile funds over the three-year period had 37 per cent in bonds in 2007 versus 28 per cent bonds for the bottom quartile performers.
In line with the earlier crash and as would be expected, investors across the quartiles continued to rebalance throughout the GFC. Using the same example, the average stock allocation for the bottom quartile funds would have fallen from 67 per cent in 2007 to 50 per cent in 2008, rather than the 64 per cent that is seen.
Funds continued to be disciplined in their rebalancing. In neither time period was there a low performing group who started with high stocks, did not rebalance after the crash, and then missed the recovery.
There was notable movement towards bonds through the three-year GFC period however, but it was more likely a strategic shift rather than a failure to rebalance. Top quartile funds in 2007 started at a 37 per cent allocation to fixed income and ramped that up to 45 per cent over the next three years. Even bottom quartile investors modestly increased their bond holdings over the three-year period, from 28 to 30 per cent. This looks to be a continuation of a trend towards LDI and diversification that began before the GFC, but the crash seems to have accelerated this movement. In fact, the average asset allocation of every quartile moved towards the strategy that helped the most in the initial downturn.
What can be learned from these market events? Two themes were common among top quartile performers in both events.
First, top quartile performers consistently had more defensive allocations pre-crash. Second, investor discipline in rebalancing allowed more upside capture in the recoveries and was widely rewarded across both market events.
One theme was different. Top-quartile investors captured even more upside in the dot-com recovery by ‘buying the dip’ and increasing their equity allocations. In contrast, top quartile investors in the GFC increased their allocations to bonds.
Chris Flynn and Franco Wang work at CEM Benchmarking.


Leave a Comment
You must be logged in to post a comment.
Login