
Norway’s $2 trillion Government Pension Fund Global has retained its title as the world’s most transparent fund, scoring a perfect 100 out of 100 for the second year in a row, according to the results of this year’s Global Pension Transparency Benchmark.
A joint initiative between Top1000funds.com and CEM Benchmarking, the 2025 edition of the GPTB marks the final instalment of this five-year project, which was established to showcase best practice in the industry and provide a self-improvement framework for fiduciary investors.
The full assessment consists of 155 questions determining funds’ levels of transparency across the disclosures of cost, governance, performance and responsible investing. A total of 11,625 data points from 75 funds were analysed by the CEM Benchmarking research team in 2025.
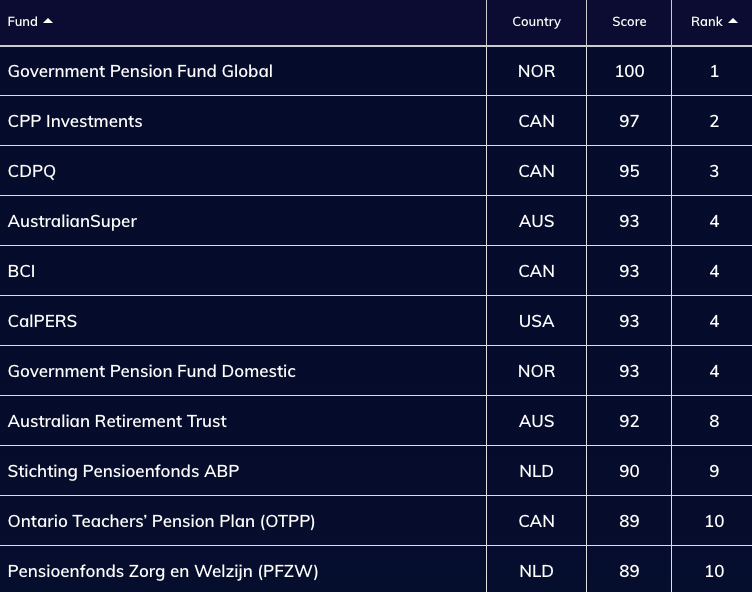
The Government Pension Fund received a perfect score in 2025 and 2024, a notable improvement from an overall transparency score of just 75 in 2022. The fund’s prioritisation of transparency has come from the top with CEO Nicolai Tangen telling Top1000funds.com in 2023 that transparency is integral to the fund’s ambition of becoming “the world’s leading fund, full stop”.
CPP Investments was in second place in 2025, with a score of 97 points and Quebec’s CDPQ displaced CalPERS in third place.
This year has proven to be particularly competitive with four funds tied in fourth with the same transparency score: AustralianSuper, BCI, Norway Domestic Fund and CalPERS.
The A$330 billion ($215 billion) Australian Retirement Trust ranked ninth with 92 points and was the biggest improvement among all funds over the past four years. In 2022, QSuper – which later merged with SunSuper to form Australian Retirement Trust – scored just 49 points, but the consolidation has prompted the creation of more rigorous public reporting standards.
CEM Benchmarking product manager Edsart Heuberger reflects that scale, mandates and types of investment holdings are all factors that drive a fund’s transparency ranking. For example, it is more difficult for Canadian funds to achieve a perfect score with their massive private asset books than the Government Pension Fund, which only invests in listed markets, he says.
There are also external factors like regulation which dictate the types of disclosures funds need to make as a minimum requirement.
Heuberger says there is a unique dynamic in benchmarking transparency compared to, for example, benchmarking fees or performance.
“What you typically see [in any kind of benchmarking] is that the leaders set a bar, and everyone else follows and gets closer, whereas this benchmark, it was very obvious from the beginning, and the leaders were making the greatest improvements – the laggers were not,” he says.
2025 improvements
That said, 2025 marked the first time an equal number of funds improved their scores in the top and bottom halves of the ranking, showing that public scrutiny continues to translate into industry practice alignment.
Across all funds, 61 per cent improved their score (compared to 72 per cent last year) and 15 per cent had worse scores.
In 2025, 19 of the top 20 funds maintained or improved their scores from last year. Sweden’s AP4 was the only fund to slip – down one point and five places – highlighting again the fierce competition among leading funds.
As the project comes to an end, Heuberger encourages funds to keep using the GPTB framework for improving and maintaining a transparent organisation for stakeholders.
“For the top 10 funds, there is a next echelon of transparency with smaller improvements … but I think there is an upper limit to this,” says Heuberger.
“A tip for everyone is to just look at the best disclosures in the world, because what some leading funds do is very inspirational for other funds and something to look up to.”


Leave a Comment
You must be logged in to post a comment.
Login