The Global Pension Transparency Benchmark has revealed the top ranking funds globally for transparency of disclosure across cost, governance, performance and responsible investment. Click here for the results of 75 funds across 15 countries.

The GPTB, a collaboration between Top1000funds.com and CEM Benchmarking, measures the transparency of disclosures of 15 pension systems across the four value generating measures, with the country scores amassed by looking at the largest five asset owners in each country. Now the scores of these underlying asset owners have been revealed for the first time.

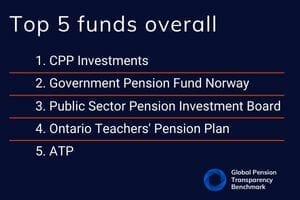
CPP Investments has emerged with the best score overall followed by the Government Pension Fund of Norway, the world’s largest sovereign wealth fund.

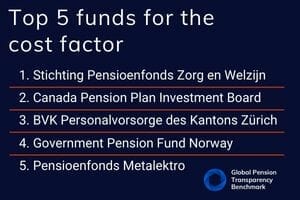
For cost disclosures the large Dutch fund, PFZW, ranked number one followed by CPP Investments.

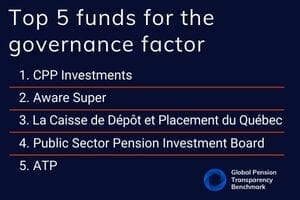
CPP Investments also took the top honour for transparency of disclosure related to governance, followed by Australia’s Aware Super.

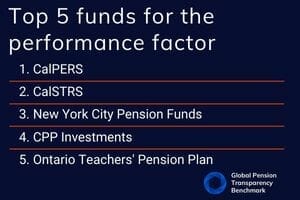
The two top funds for transparency related to performance were the large Californian funds CalPERS and CalSTRS.

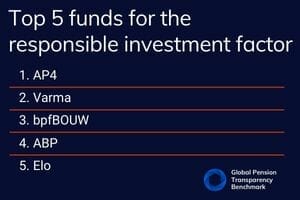
And for responsible investment, funds in Europe dominated with Sweden’s AP4 taking the top spot followed by Varma.

It is the second year that the GPTB has ranked countries on the transparency of disclosure related to the four factors of cost, governance, performance and responsible investment. Both years Canada topped the country list overall.

Canada’s dominance is demonstrated by the fund five’s analysed in that country all featuring in the top 11 funds overall. They were CPP Investments (1st), PSP Invesments (3rd), Ontario Teachers Pension Plan (4th), BCI (8th) and CDPQ (11th).

Click here for an interactive table for all countries and all funds and click here for analysis of the individual funds, their rankings and related stories.


CPP Investments has topped the list of the most transparent funds according to the Global Pension Transparency Benchmark, which has revealed the scores of the 75 underlying funds from 15 countries for the first time.

The GPTB, a collaboration between Top1000funds.com and CEM Benchmarking, measures the transparency of disclosures of 15 pension systems across the value generating measures of cost, governance, performance and responsible investments.

The scores for the countries are amassed by looking at the largest five asset owners in each country. The scores of these asset owners have been revealed for the first time.

CPP Investments emerged with the best score overall and also the best score for governance disclosures.

Three Canadian funds featured in the top five of the best overall funds. Canada also topped the country list in 2022 for the second year in a row.

The Dutch fund, Stichting Pensioenfonds Zorg en Welzijn (PFZW), topped the list for cost; CalPERS for performance; and Sweden’s AP4 was the best fund for transparency of disclosures related to responsible investment.

The GPTB provides an insight into the disclosure practices of asset owners around the world with a focus on transparency.

The Global Pension Transparency Benchmark is a world first global standard for pension disclosure, bringing a focus to transparency in a bid to improve pension outcomes for members.

Revealing the underlying fund scores aims to focus on best practice and encourage improvement on transparency of disclosures.

Head of business development at CEM Benchmarking, Mike Heale, says transparency is the right thing to do and the smart thing to do.

“Congratulations to the top-ranking funds on the GPTB for leading the way on transparency and communication quality,” he says.

The top five funds overall and by factor are listed below and the full list with search functionality can be found here.

Click here for analysis of all the country results.


The GPTB measures whether pension organisations are disclosing what they do and how they are generating value for stakeholders clearly, completely, and concisely. Disclosures continue to be scored across four equally weighted factors: cost, governance, performance, and responsible investing, with more than 10,000 data points analysed across the 15 countries and 75 funds.

Click here for the full methodology.


Optimising portfolio design in a risk / return framework has challenged industry and academics for many decades. Incorporating impact into this framework creates additional dimensionality, significantly increasing the complexity of the portfolio design challenge. This article explores the technical challenge of navigating the 3-D investment framework.

A primer on modern portfolio theory – the 2-D challenge

The foundation of modern portfolio theory is the work of Nobel prize winners Harry Markowitz, James Tobin, and Bill Sharpe. There are various interpretations of the framework, and sometimes it is unfairly criticised. Markowitz sets out a framework for creating an efficient (mean-variance) frontier of portfolio opportunities. Tobin and Sharpe extend on this foundation to demonstrate how to improve risk / return efficiency by blending cash or leverage with the portfolio which has maximum (expected) excess return relative to variance (the ‘market portfolio’).

There are many challenges to modern portfolio theory. These range from the subjectivity of inputs, return distributions for different investments, the way that different investments blend, and liquidity. The broad takeout: be efficient with risk when seeking return.

Interestingly some institutional investors are better placed to efficiently manage the risk / return trade-off.

Pension fund leverage is one example: Australia’s superannuation funds are restricted from applying portfolio leverage directly whereas pension funds in the US, Canada and parts of Europe have fewer restrictions and have incorporated leverage into their portfolios.

Incorporating a third dimension: impact

Accounting for impact creates a fascinating, but complex challenge. Impact represents a third dimension in the portfolio decision framework. To enable us to explore this framework we make two important assumptions:
1. That sustainability and ESG can be aggregated into a single variable: impact.
2. That impact can be measured in a continuous manner (i.e. there is an infinite, not a discrete set, of impact measurements).
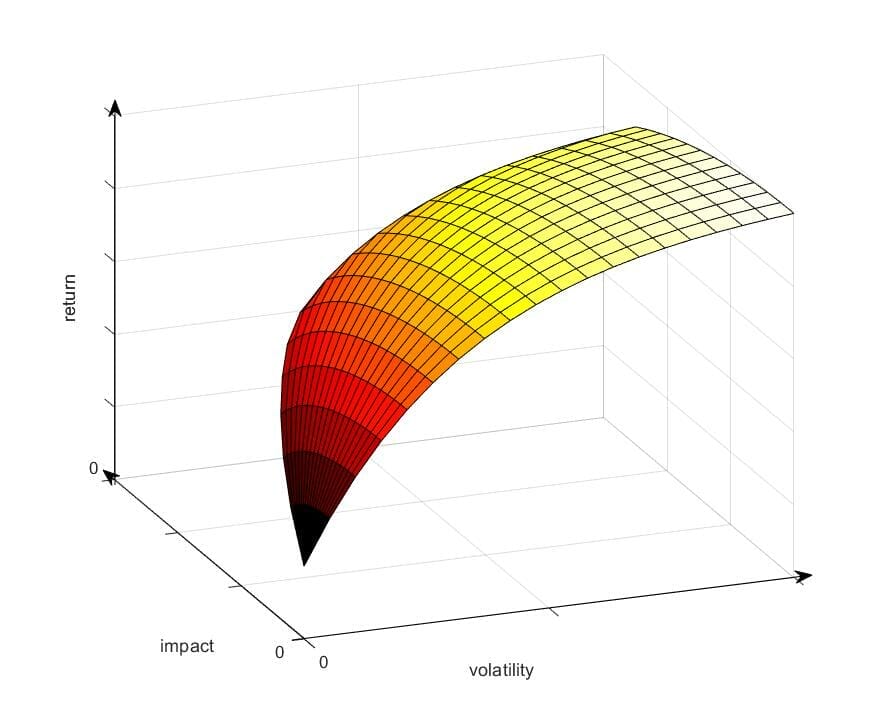
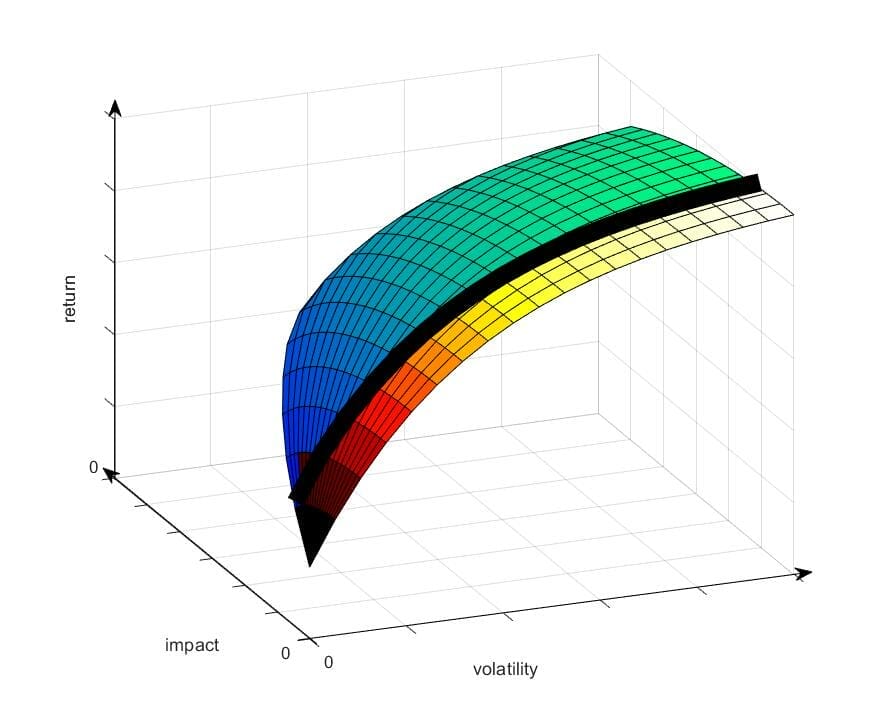
A third portfolio variable introduces significant complexity. Where there was one trade-off to consider (return versus risk) there are now three: return versus risk, return versus impact, and risk versus impact. Instead of searching for the optimal portfolio on a two-dimensional risk / return frontier, there is now a three-dimensional risk / return / impact surface on which to locate the optimal portfolio. We illustrate this in Figure 1.


Figure 1: A three-dimensional risk (volatility) / return / impact surface.

Based on Figure 1 we make some important observations:

1. Higher risk, measured by volatility in our simplified framework, can be applied to increasing expected returns and impact (or both).

2. We entertain the possibility that there is a trade-off between impact and return.

3. If we ignore impact the framework collapses down into the familiar modern portfolio theory efficient frontier.

4. For every degree of impact there exists a risk / return frontier.

Accounting for active ownership and engagement

The opportunity for active ownership and engagement activities to improve impact with no effect on returns is topical (here and here). We model the commitment to universal investor activities as incurring a fixed cost (establishing a team, systems etc.) and delivering a fixed expected benefit. Hence the outcome is a fixed uplift in impact.

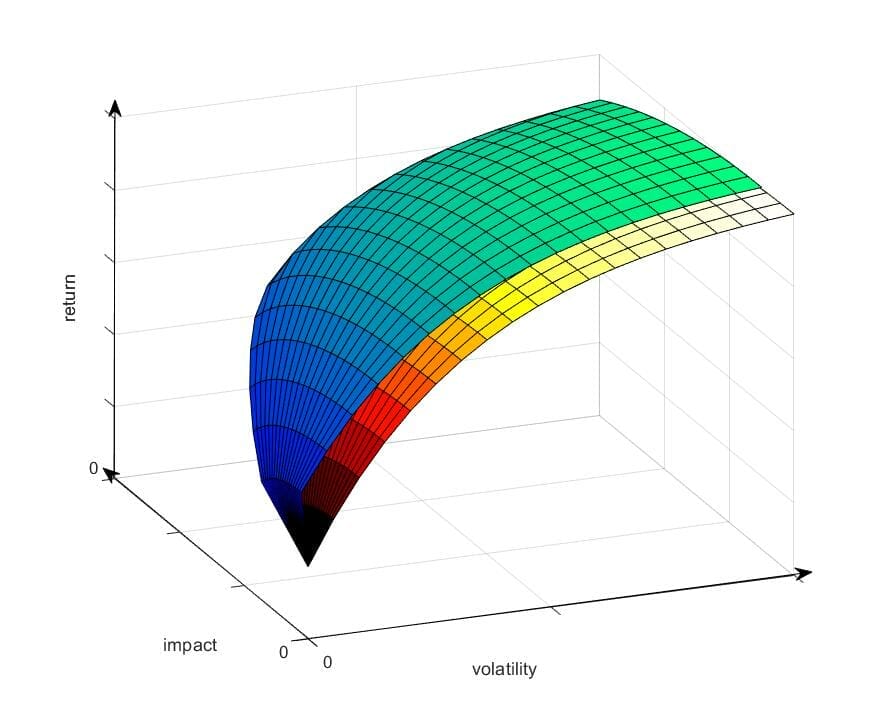
This is reflected in Figure 2.

Figure 2: Illustrating the effect of undertaking a program of active ownership and engagement activities.

Figure 2 depicts two surfaces. The first (shaded yellow / red) carries over from Figure 1. The second (green / blue) sits further along the impact axis by the degree of expected net impact from undertaking a program of active ownership and engagement activities.

Identifying the optimal portfolio

Identifying the optimal solution becomes more difficult as more dimensions are added to any problem (econometrician John Rust famously described this as the “curse of dimensionality”).

For academics, utility functions remain the cornerstone for setting objectives, aided by ever-increasing computing power. Utility functions appear to be less applied in industry, perhaps because of their complexity.

A utility function assesses the distribution of possible portfolio outcomes. In doing so it implicitly establishes trade-offs between different dimensions. While traditionally the dimensions have been risk and return, the utility function approach has the capability to provide objectivity when faced with the 3-D challenge created by the incorporation of impact. Note that the trade-offs are not necessarily linear. The exercise of exploring and formalising these trade-offs would make for a wonderful learning experience for pension fund boards.

Two alternative approaches are more likely to be applied, at least in the near-term, as industry adopts 3-D investment frameworks.

Approach 1: Targeted impact

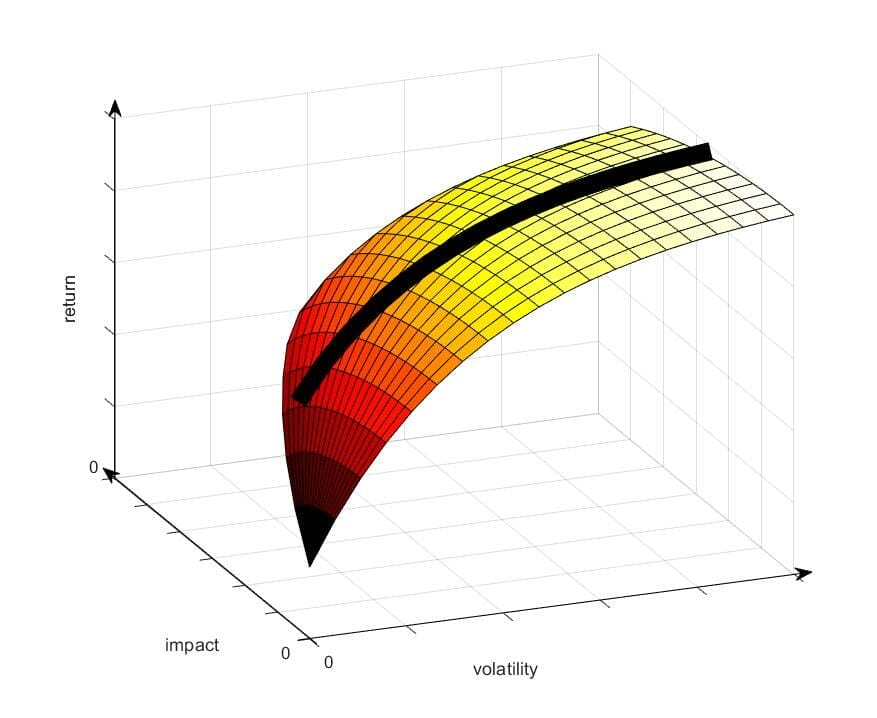
The first approach is to target a specific degree of impact. This effectively converts the 3-D surface back to a single 2-D investment frontier (the thick black line), detailed in Figure 3. This returns the portfolio decision to the familiar 2-D investment frontier problem.


Figure 3: Targeting a fixed degree of impact creates a single risk / return frontier.

Approach 2: Minimum impact threshold

The second alternative approach is to set a minimum impact threshold. This effectively divides the 3-D surface into two segments, both 3-D. In Figure 4 portfolios on the yellow / red surface fail to meet a minimum impact threshold, while portfolio managers are free to search the blue / green surface for the best portfolio outcome.

The advantage of this approach compared to Approach 1 is that it allows portfolio managers to further explore the trade-off between impact and return. For instance further impact may have been attainable, beyond the fixed threshold applied in Approach 1, with little impairment of returns.

Figure 4: Establishing a minimum impact threshold divides the 3-dimensional risk / return / impact surface into two segments.

Challenges in practice

There are significant in-practice challenges to 3-D investing, which exist over and above the known difficulties of 2-D investing (forecasting return, risk etc.). These include:

  • Measuring impact, where the availability of many different datasets creates confusion. A particularly difficult component is the challenge of integrating ESG into a single impact measurement.
  • Matching the timeframe of forecasts for risk, return and impact.

For these reasons it is unlikely that pension fund portfolio construction in a 3-D world will become purely systematised any time soon. For 3-D investing to approach systematisation it would require these issues to be addressed while resolving how to set an objective – perhaps utility functions will come to the fore.

Applying some of the outlined portfolio management science will be important: plan members and regulators will at some point want to understand how portfolio trade-offs have been determined. Many of the leading pension funds and asset managers are already well advanced on the technical aspects. But decision-making art will be an important complement to decision-making science.

A final observation is that the role of the portfolio manager will become even more important: portfolio managers will need to understand the range of portfolio outcome possibilities and lead their respective boards through a process for determining an appropriate portfolio. Education and communication remain essential skills.

David Bell is executive director of The Conexus Institute

BHP chief executive, Mike Henry, explores the growing role of mined commodities in the global energy transition. This fireside chat was hosted by Amanda White at the Australian Fiduciary Investors Symposium in June. Henry talks about the company’s progress and the challenges of Scope 3 emissions. Listen to the full interview here.

Demand for commodities is insatiable as emerging economies continue to develop and the challenge to ensure “the world’s need for metals and other resources is met in the most sustainable way possible,” says the boss of the world’s largest mining company.

Mike Henry, the chief executive of BHP, says the ambition to limit global warming to 1.5°C is a metals-intensive effort and increased supply will have to come from mines that are lower grade, smaller and in tougher jurisdictions.

“We’re at a point in time where industry, capital markets and other actors need to lock arms to figure out how we can go about accelerating the efforts to improve ESG standards and governance,” Henry said. “And in doing so ensure that the world’s need for resources is met in an efficient way, and a way that minimises the downside impacts.”

He was speaking during an interview with Amanda White at an event held by Top1000funds.com’s sister publication, Investment Magazine, where he said BHP had been making strides to lower its Scope 1 and 2 emissions. Scope 3, he admitted, had unique challenges.

Henry cited the example of BHP exiting coal-fired power generation for its copper production in Chile at a time where there was no external pressure to do so. The company initially used gas-fired power for its Chilean operations and is expected to rely fully on renewable energy in the next two years, a move that will reduce its overall Scope 1 and 2 emissions by around 15 per cent.

As one of the world’s largest dry bulk charterers, BHP is using its significant purchasing power to work with ship owners to develop LNG-powered bulk carriers, which emit about 30 per cent less greenhouse gas than existing bunker fuel.

However, Henry recognised the challenge in lowering Scope 3 emissions across its value chain as “we don’t have the ability to drive that investment decision.”

The lack of global standards on how to measure and report on Scope 3 emissions as well as the absence of technologies in certain supply chains to eliminate this category of emissions also add to the difficulty.

BHP is also collaborating with other firms to develop technologies to remove diesel from its operating sites such as using electrified overhead tram systems.

Recruitment and retention of investment and operations staff at the $79.4 billion Alaska Permanent Fund Corporation is now so acute the fund is exposed to operational risk with potential adverse impacts on performance and corporate reputation.

So heard the board of trustees in a specially-convened meeting to discuss the issue following an unprecedented wave of staff leaving the fund in recent months that includes Steve Moseley, deputy chief investment officer and head of alternatives, and the entire operations team who will exit APFC on the same day in August. Others include the director of administrative operations – a big gap going into the budget – and members of the IT and procurement teams. Here the fund has only received 10 applications in the last five months, none of which meet the minimum qualification.

The board heard how the root cause of the problem lies with “materially below par” compensation linked to budget constraints. It means efforts to train and develop staff are often wasted as many are snatched away by those able to pay more, leaving APFC struggling to build a bench of talent. Trustees heard how one recent leaver had gone to a salary paying 200 per cent more.

For sure, trustees heard how departures should be seen in the context of the high turnover in the wider investment industry and the Great Resignation through the pandemic. Moreover, APFC has added some 17 positions over the last five years.

However, employees have left the fund over a short period of time rather than throughout the year, and APFC’s already smallish internal team leave departures more keenly felt than if they were spread cross a deeper organisation. It means team members are wearing multiple hats like the chief compliance officer also doubling up as chief risk officer. Chief investment officer, Marcus Frampton, currently has 11 direct reports.

Trustees heard how the exodus of APFC’s three-strong operations team, who provide essential support to the internal trading of the portfolio and trade settlement, is particularly linked to the fact they are not bonus eligible unlike the investment team, creating a rift in culture and team spirit.

Their exodus has led to APFC now hunting a costly, outsourced solution to the services they provide.

“It is not an area of operations we can afford to have gaps in support,” trustees heard.

Incentive compensation

In an approach designed to fit with wider pay structures across Alaska’s public sector, incentive compensation only applies to investment personnel. However, although it was first approved in 2018, in the years since the investment team have experienced changes to payout levels that have resulted in haircuts to their bonus. Most recently, bonus payments were reduced by about 44 per cent.

The level of bonuses that investment team members receive is a complex process with many contingencies.

Payouts are capped at a percentage of salary; bonus calculations take into consideration individuals’ prior compensation and performance of the total fund as well as asset class weightings. Short and long-term performance also goes into the calculation.

In another complexity, bogey levels or targets by which the investment team need to beat the benchmark to fully earn their bonus, are notably steeper in fixed income compared to peer funds.

Frampton told the board candidates read the policy and dislike the lack of clarity on the bonus structure. He said that paying out incentive compensation is crucial to motivate investment staff.

Solutions

Other considerations the board discussed to support recruitment and retention included  locating staff in Anchorage and developing a more flexible approach to work. So far only three members of the investment team are approved to work remotely.

Trustees heard how starting salaries on the operations side are not much higher than for a public accounting firm.

Other solutions include working with local universities and building the intern program.  Trustees also heard about the importance of encouraging and nurturing internal growth and promotion, offering different titles, levels of promotion and compensation.


The investment team overseeing Canada’s Caisse de dépôt et placement du Québec, CDPQ, C$45 billion infrastructure portfolio, tripled in size since 2016, is now targeting C$75 billion assets under management by 2025.

In a dynamic strategy, CDPQ deliberately hunts large, direct investments in new geographies where returns come from generating growth in the underlying companies.

Last year the portfolio returned 14.5 per cent, its highest absolute return in 1o years and streaked ahead of peers ploughing a record C$11 billion into transportation, energy and social and telecommunications assets but there is still much to do, explains Emmanuel Jaclot, executive vice-president, and head of infrastructure in an interview from CDPQ’s Montreal headquarters.

“We’ve got a lot of capital to deploy.”

Crown jewels

The latest addition to CDPQ’s infrastructure portfolio, a 22 per cent stake in Dubai’s Jebel Ali Port, free zone and National Industries Park shows the skills Jaclot’s team now wield. Rather than wait for these crown jewel assets to come up for sale and bid in a competitive process, CDPQ’s close relationship with port operator DP World via existing co-investments in global assets including a container port and logistics park in Indonesia, meant the team knew the state-owned logistics giant was seeking to refinance debt.

CDPQ’s negotiation on price and terms focused particularly on ensuring the deal included a stake in the port and logistical zone. All the while working to ensure the deal wasn’t opened to other investors and remained CDPQ’s to lose.

“We suggested a structure where we buy a stake in the port and logistical zone. At any point they could have opened the process to other investors, but we managed to keep it a bilateral discussion,” says Jaclot. “It is significant that they have allowed a foreign investor to invest in their home port that is such a strategic part of the economy of Dubai.”

Debt vs equity

The C$5 billion deal comprises a C$2.5 billion equity investment alongside C$2.5 billion of debt in a balance Jaclot explains has been key to the process. Particularly keeping the debt levels low enough to ensure the deal remains investment grade and low risk in a climate of rising rates.

“The more debt you manage to raise, the better it looks for the equity return but it also increases the risk level, and we like to keep a low level of risk in our infrastructure portfolio.” Speed of execution during the recently completed debt syndication, important in the context of today’s markets, was also essential.

The investment also captures the key rationale that now drives infrastructure investment at CDPQ. The economics of the port, its revenue and margin, are uniquely tied to Dubai (the Jebel Ali facilities account for almost a quarter of the Emirate’s economy) and the wider region, set to perform well in the coming years boosted by factors like the region’s strong recovery from the pandemic and more recently, the surge in Russians seeking financial haven in Dubai.

The bulk of the imports coming into the port are for domestic consumption and industrial processes in the UAE and neighbouring countries, Jaclot explains.

“Our investment is generally correlated to the GDP of a zone that spans from South Asia to Africa, and we feel there are robust revenues and profits there. The region will have a slightly different growth path in the next few years to America and Europe.”

Wider portfolio

CDPQ’s infrastructure portfolio is playing a key role counter-balancing the impact of rising inflation. A fair portion of contracted assets include indexation to inflation while other regulated assets also comprise forms of indexation to inflation. The portfolio is also protected from rising rates and the cost of debt, he explains. “Fortunately, in most cases we have fixed or swapped interest debt, so we are not hit by rising interest rates in the short to medium term, until we come to re-finance. Net-net, inflation isn’t hurting the portfolio much and CDPQ wants to invest more in infrastructure.”

CDPQ tends to target deliberately large transactions, less competitive than the mid-market space, and is busy expanding into new geographies (investment in DP World was its first in the region) including Latin America while teams in India, Singapore, and Sydney scour for opportunities.

Importantly, the portfolio is also growing thanks to growth in the underlying portfolio companies as they build and develop new projects. A  process epitomised by CDPQ’s investment in companies like fast-growing US renewables developer Invenergy Renewables.

“We like to reinvest the cash-flow and create value within our portfolio companies,” explains Jaclot.

The focus on regions is based on the ability to scale investments and a local presence. For example, recently acquired transmission assets in Brazil, Uruguay and Peru are managed out of the Sao Paulo office, while opportunities in Indonesia are managed out of Singapore. “We are not a huge team so can’t be spread too thin but having our teams close to our assets is essential,” he says.

Decarbonization

Decarbonizing the portfolio is another central seam, part and parcel of CDPQ’s initial target to reduce emissions across its entire C$419.8 billion portfolio by 25 per cent by 2025 linked to compensation, since expanded to target a 60 per cent reduction by 2030. Much of that ambition, keenly watched by carbon bean counters in the actuary and accountancy teams, has fallen on the shoulders of the infrastructure department via increasing exposure to green renewable assets. “We have been ahead of the curve; we got in early in renewables and ahead of the market coming in with higher valuations,” says Jaclot.

Rather than selling – and choosing not to buy – carbon emitting infrastructure assets, CDPQ has embarked on a slightly different path. Last autumn it created a $10 billion transition envelope to support decarbonisation in the main industrial carbon-emitting sectors.

“I’d much rather keep or take ownership of the asset and decarbonise it. We could sell our CO2 emitting assets, but someone else just ends up buying them,” says Jaclot. News regarding assets bought specifically to decarbonise will be announced shortly; elsewhere the fund  has shut down coal plants and replaced production with gas and solar in concrete decarbonization.

Still, the challenge of decarbonizing infrastructure like airports (CDPQ has a 12 per cent stake in London’s Heathrow alongside others including USS, GIC and China Investment Corporation) given most emissions come from the aircraft is increasingly front of mind. ““North of 95 per cent of emissions at most airports come from the aircrafts but human beings need to meet and travel to some extent. We are pushing to find solutions, even though they come at a higher cost such as sustainable aviation fuel. Heathrow is at the forefront of this initiative.”

Investing with DP World has also bought CDPQ’s commitment to the S and G of the ESG under scrutiny. The company attracted widespread criticism when it fired 800 British-based crew from its P&O ferries business.

“To be frank, the news of workers at P&O Ferries made us look even deeper for reassurance and we took comfort in the reaction,” he said, noting the subsequent settlement DP World reached with workers. He is also encouraged by the growing diversity of DP World’s workforce and improving health and safety at the company.