

The Dynamic US Equity (DUSE) story officially begins in 1989. However, its origins date back to the 1970s. Bill Fouse and Tom Loeb, the two co-founders of Mellon Capital (predecessor firm prior to joining Newton Investment Management), pioneered the practical application of economic theory and are credited with creating the first equity index strategy. In the mid-1980s, Mellon Capital also developed expertise in global tactical asset allocation (GTAA) and calculating valuations (or premia) for global stock and bond indices.
DUSE was an outgrowth of these competencies. The catalyst came from an index client that had grown disenchanted with traditional active equity management and asked if there was an alternative method to generate alpha. The challenge then, as it is now, was to produce an excess return over the S&P 500® utilizing asset-allocation concepts while maintaining a similar level of market risk.
DUSE sought to utilize the market structure as highlighted by the Capital Asset Pricing Model (CAPM) to generate excess returns. Conceptually, the idea was to blend index exposures in the S&P 500 (stocks), long US Treasuries (bonds), and cash while also allowing for modest leverage. We believed the approach would generate more consistent returns over the S&P 500 than was possible with traditional active strategies that rely on stock picking.
Modern portfolio theory in practice
The investment process relies on forward-looking asset premia, risk and correlations to determine the optimal allocation to stocks, bonds and cash and the appropriate level of leverage. The first question we ask is, “Are stocks attractive?” The second question is, “Are stocks attractive relative to bonds?” If the answer to both questions is yes, we overweight stocks (usually 15-20%). Next, we blend in an allocation to bonds and cash for diversification and additional sources of alpha. Put succinctly, the process encompasses:
- Our proprietary expected return calculation for stocks, bonds and cash (asset premia).
- Our proprietary expected risk calculation for each asset class and their correlations.
- Mean-variance optimization to arrive at the optimal allocation (highest Sharpe Ratio).
The optimal portfolio is the ideal blend of stocks/bonds/cash that offers the highest return per unit of risk. In the illustration below, this optimal portfolio lies on the efficient frontier at the point of tangency(1). The tangent portfolio, however, has a notable limitation in that both the expected return and risk are typically lower than a 100% stock portfolio. Given DUSE’s objective to outperform stocks, this limitation would be a non-starter. This is where leverage comes in. By allowing a modest amount of leverage, we can move up the capital market line(2) (the straight line connecting cash and the point of tangency) to construct a portfolio that has a similar risk as stocks but also offers the opportunity for excess returns above stocks.
Sample Efficient Frontier
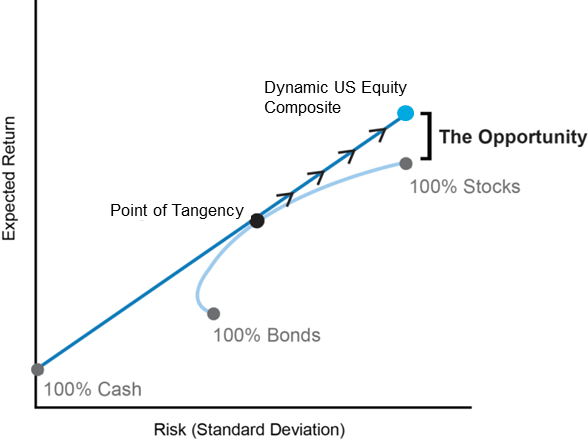
Leverage in DUSE is modest. The leverage is used prudently to move up the capital market line when risky assets (stocks and bonds) are attractive or underpriced. We allow up to 50% leverage, and often do not use the full amount. Furthermore, leverage is obtained through listed and exchange-traded index futures and index option contracts(3); there is no direct borrowing. Finally, the equity leverage is implemented through S&P 500 options only; thus, during a market correction the options reduce the equity overweight as the options’ exposure shrinks to zero. Nonetheless, for some investors the use of leverage understandably conjures up nightmares of outsized losses. DUSE’s intelligent design and multi-tiered risk control have yielded robust downside protection over its 32-year live history.
- The strategy’s risk-mitigation factors include:
- Tail-risk mitigation through use of options
- Multiple risk models employing fundamental, macro and credit market data
- Long US Treasury bonds as a defensive hedge
- Extensive scenario analysis / stress testing
Over its full history, DUSE has produced a compelling 90% down capture versus a 106% up capture.
When launched in 1989, most agreed that DUSE was an innovative yet unconventional approach. Today, interestingly, not much has changed. In harmony with its design, based on sound and well-recognized financial theory, the return stream has exhibited low correlation to more traditional, active approaches that engage in security selection or factor tilts.
At the end of the day, investors care about alpha, and DUSE has delivered. Since its launch in September 1989, the strategy has produced an annualized alpha (net of fees) of 2.8%. Moreover, the realized returns and risk over this period resemble the conceptual diagram of the CAPM diagram shown above.
Proof statement
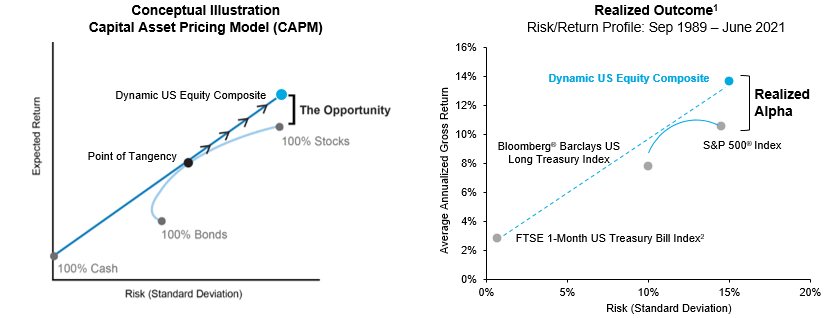
PAST PERFORMANCE IS NOT NECESSARILY INDICATIVE OF FUTURE RESULTS. Inception date: August 31, 1989. 1 On an annualized basis, net of fees since inception. 2 The Bloomberg® Barclays US Long Treasury Index, FTSE 1-Month US Treasury Bill indexes are being shown for comparison purposes only and are not official benchmarks for this strategy. A definition of these indexes can be found at the end of this paper. The graph on the left-hand side is for illustrative purposes only and does not reflect actual returns. Performance presented for measurement periods prior to February 1, 2018 represents the portable performance results of a prior affiliated firm which have been linked to the ongoing track record for the composite or the composite’s representative account shown as supplemental information. Data sources: Firm Research, S&P 500, Bloomberg®. Performance is expressed in US dollars. The information shown above is supplemental to a corresponding GIPS compliant presentation, which has been prepared and presented in compliance with the Global Investment Performance Standards (GIPS®), in the back of this presentation. See Additional Information in Disclosure Statements.
While DUSE was originally designed to outperform the S&P 500, through client demand we continue to expand the Dynamic Equity platform to include other equity markets. The requirements to expand DUSE to additional equity indexes are fairly basic: we must be able to evaluate the premium of the underlying equity market (e.g. using consensus earnings estimates and company-level fundamentals), determine the risk and correlation profile, have access to a reasonably liquid futures market, and be able to buy options for leverage and tail-risk protection.
Today the Dynamic Equity platform covers a wide spectrum of equity markets, including global equities, style indexes (value and growth) and, most recently, US small cap stocks. We can also implement Dynamic Equity as a pure overlay, effectively porting the excess return stream over any market exposure. With over USD 18 billion in assets under management as of August 31, 2021, the Dynamic Equity platform is gaining traction in the marketplace as investors search for reliable and uncorrelated alpha that can be deployed at scale.
Finally, we must recognise the implications that digitalisation has on sustainability. The consideration of environmental, social and governance (ESG) factors can be a useful tool to achieve a more holistic picture of companies. There are various ESG issues that are prevalent in the technology sector, in particular around social media, cyber security, and (as mentioned) data privacy. In addition, many of the large technology companies have voting structures that can be detrimental to shareholders. All of these risks must be monitored.
We look for businesses that will survive and thrive for not just the next few years, but for the next few decades, and the focus on sustainability has led to new business opportunities. A good example of this is a global leader in industrial software. The company essentially creates a digital representation of a physical asset for industrial businesses. This virtual model is able to study the asset and suggest potential improvements, thereby improving the efficiency of industrial processes. Not only does this have financial advantages, but also significant environmental benefits, including reduced waste and lower carbon emissions.
Dynamic Equity assets under management
| USD Million | Total Assets | Separate Account | CIT | UCITS | Mutual Fund | Inception |
| Dynamic US Equity (DUSE) | 8,771 | 2,724 | 1,936 | 576 | 3,536 | Sep-1989 |
| Dynamic US Small Cap Equity (DUSE R2) | 7,120 | 7,119 | Jan-2021 | |||
| Dynamic US Large Cap Equity (DUSE R1) | Jan-2021 | |||||
| Dynamic US Equity Overlays! | 1,740 | 1,740 | Dec-2019 | |||
| Dynamic Global ex-US Equity (DEXUS) | 567 | 30 | 537 | Jul-2018 | ||
| Total | 18,198 | 4,494 | 9,592 | 576 | 3,536 |
Important information
This is a financial promotion. This article is for institutional investors only. Material in this article is for general information only. The opinions expressed in this article are those of Newton and should not be construed as investment advice or recommendations for any purchase or sale of any specific security or commodity. Any reference to a specific country or sector should not be construed as a recommendation to buy or sell this country or sector. Please note that strategy holdings and positioning are subject to change without notice. Newton manages a variety of investment strategies. Whether and how ESG considerations are assessed or integrated into Newton’s strategies depends on the asset classes and/or the particular strategy involved, as well as the research and investment approach of each Newton firm. ESG may not be considered for each individual investment and, where ESG is considered, other attributes of an investment may outweigh ESG considerations when making investment decisions.
Issued by Newton Investment Management Limited, The Bank of New York Mellon Centre, 160 Queen Victoria Street, London, EC4V 4LA. Registered in England No. 01371973. Newton Investment Management Limited is authorized and regulated by the Financial Conduct Authority, 12 Endeavour Square, London, E20 1JN. ‘Newton Investment Management Group’ is used to collectively describe a group of affiliated companies that provide investment advisory services under the brand name ‘Newton’ or ‘Newton Investment Management’. Investment advisory services are provided in the United Kingdom by Newton Investment Management Ltd (NIM) and in the United States by Newton Investment Management North America LLC (NIMNA). Both firms are indirect subsidiaries of The Bank of New York Mellon Corporation (‘BNY Mellon’). Newton Investment Management Limited is registered with the SEC as an investment adviser under the Investment Advisers Act of 1940. Newton Investment Management Limited’s investment business is described in Form ADV, Part 1 and 2, which can be obtained from the SEC.gov website or obtained upon request.
Personnel of certain of our BNY Mellon affiliates may act as: (i) registered representatives of BNY Mellon Securities Corporation (in its capacity as a registered broker-dealer) to offer securities, (ii) officers of the Bank of New York Mellon (a New York chartered bank) to offer bank-maintained collective investment funds, and (iii) Associated Persons of BNY Mellon Securities Corporation (in its capacity as a registered investment adviser) to offer separately managed accounts managed by BNY Mellon Investment Management firms, including Newton.
Certain information contained herein is based on outside sources believed to be reliable, but their accuracy is not guaranteed. Unless you are notified to the contrary, the products and services mentioned are not insured by the FDIC (or by any governmental entity) and are not guaranteed by or obligations of The Bank of New York or any of its affiliates. The Bank of New York assumes no responsibility for the accuracy or completeness of the above data and disclaims all expressed or implied warranties in connection therewith. © 2021 The Bank of New York Company, Inc. All rights reserved.
In Canada, Newton Investment Management Limited is availing itself of the International Adviser Exemption (IAE) in the following Provinces: Alberta, British Columbia, Ontario and Quebec and the foreign commodity trading advisor exemption in Ontario. The IAE is in compliance with National Instrument 31-103, Registration Requirements, Exemptions and Ongoing Registrant Obligations.
1) Sharpe, William F. 1964. “Capital Asset Prices: A Theory of Market Equilibrium under Conditions of Risk.” Journal of Finance. 19:3, pp. 425-42.
2) Tobin, James. 1958. “Liquidity Preference as Behavior Toward Risk.” Review of Economic Studies. 25:2, pp. 65-86. Tobin added the notion of leverage to portfolio theory by incorporating into the analysis an asset which pays a risk-free rate. By combining a risk-free asset with a portfolio on the efficient frontier, it is possible to construct portfolios whose risk-return profiles are superior to those of portfolios on the efficient frontier. By combining a risk-free asset with a portfolio on the efficient frontier, it is possible to construct portfolios whose risk-return profiles are superior to those of portfolios on the efficient frontier.
3) The index futures and options are based on the S&P 500 and the 30-year US Treasury bond (adjusted to reflect the Bloomberg Barclays Long-Term US Treasury Index).


Leave a Comment
You must be logged in to post a comment.