The composition of an investment committee is the most meaningful criteria in assessing diversity, equity and inclusion in private market fund managers according to Mercer.

The consultant sets out criteria that it thinks will ensure success of a DEI program which includes: fund manager ownership, investment team composition, investment committee composition, thresholds and alignment. It believes that investment committee composition is the most meaningful criteria as this is typically where final investment decisions happen.

In the white paper, The Power of Change: The what, why and how of creating a diverse private market portfolio, Mercer says incorporating DEI into private market portfolios could result in an increased likelihood of outperforming benchmarks.

In the paper Mercer points to recent research suggesting diverse teams make better decisions and are less likely to be influenced by unconscious biases. A study conducted by the National Association of Investment Companies which looked at the diversity of private equity firms found that, from 1994 to 2018, diverse funds outperformed the top quartile benchmark on a net IRR basis, and outperformed the benchmark median quartile on a total value to paid in capital and a distributions to paid in capital basis.

“The pandemic and growing demand for social change, coupled with market volatility, have made investors realize that change is here. There are many benefits to embracing DEI, as well as risk mitigation considerations. By creating a private markets DEI investment program, institutional investors can send a strong signal to asset managers that diversity is a priority. We are working with managers and asset owners to help them transform investment management through their portfolio investment choices,” said Raelan Lambert, global alternatives leader at Mercer.

“By increasing the diversity of their managers, investors can create an environment where new ideas can thrive. This environment enables fresh perspectives and different networks through which to access potential new deal flow.”

But to develop and implement an effective DEI investment program in private markets, it is essential to have a clear, consistent and quantifiable definition of what the term means in investment practice, the paper says.

There are a couple of specific considerations that apply to due diligence around diversity within private market fund managers, the paper says. For example because some diverse managers may not have long track records, it’s essential to find ways to mitigate performance risk. In addition Mercer says it’s useful to assess the alignment of financial incentives across all professionals on an investment team and the organisation more broadly, and encourages investors to examine the decision- making influence of minority groups to ensure alignment, and make sure HR policies promote meritocratic DEI hiring, particularly within the investment team.

It is also important to have ongoing monitoring of the managers on diversity matters and investors need to create their own frameworks for monitoring and evaluating their DEI programs and ensuring they’re meeting relevant objectives and investment targets. Key performance indicators can be useful and should encourage data collection on diversity and a range of other important metrics.
 

Hugh Hacking from South Africa’s Old Mutual SuperFund refects on the impact of the pandemic on the fund and the importance of ESG integration in its externally managed portfolio.

Old Mutual SuperFund, South Africa’s R117 billion ($7.8 billion) defined contribution pension fund for around 470,000 members has weathered a tough year, but Hugh Hacking, chief operating officer at Johannesburg-based Old Mutual Corporate sees opportunities on the horizon.

“Global manufacturing activity has continued to grow,” he says. “In part it reflects the fact that consumers are spending less on services that require face to face interaction, and more on goods that can be used at home.”

Moreover, Hacking sees opportunity for South Africa’s economy – where the fund invests around 70 per cent of the assets under management – as the world economy recovers and begins to support local manufacturing and commodity prices. As for the funds’ investment priorities going forward, the focus will be on integrating responsible investment and opportunities in infrastructure and alternative asset classes along with the more traditional equity and bond investments.

But rays of hope on the horizon don’t detract from his acknowledgement of the pandemic’s impact on the funds’ investments. Smoothing and capital guarantees helped limit the impact of Covid-19 on the default investment portfolio, the Old Mutual Absolute Stable Growth Portfolio, where the majority of Old Mutual Superfund’s beneficiaries invest. But the portfolio still experienced the kind of short-term market volatility unseen since the financial crisis in 2008 and 2009.

Crucially this portfolio, which offers an 80 per cent guarantee level (meaning a maximum drawdown of 20 per cent for investors) experienced a one-off negative return declaration of -5 per cent. While the portfolio has subsequently recovered, this is the first time that Old Mutual has had to declare a negative return for one of its smoothed bonus portfolios in more than 40 years of managing them.

While markets have been improving, Hacking cautions that there is still significant uncertainty and that future investment returns will depend on the recovery of South Africa’s economy and the impact of further waves of the pandemic.

Structure

Old Mutual SuperFund offers a range of pooled investment options to cater for the varying risk profiles and philosophies of participating employers and members, and allocations span active and passive strategies.

“We have a very wide range of participating employers and members. The funds therefore need to cater for a very wide range of investment needs and preferences. Utilising pooled portfolios enables us to offer investment portfolios spanning a broad range of investment styles and risk-return profiles.”

All management is outsourced, either to external fund managers or Old Mutual’s own asset managers. The manager cohort are “well recognised and reputable managers,” and are reviewed on an annual basis, says Hacking.

Having the investments managed by South Africa’s best-known managers helps swell the membership, which ultimately helps drive down overall costs per member, he adds.

ESG

The SuperFund investment managers are required to adopt the principles set out in CRISA, South Africa’s responsible investment code, or to have signed up to the PRI.

“As part of their investment review, the SuperFund trustees request detailed information from all investment managers about their responsible investment policies and practises and how these are implemented.”

Investment managers must also report on how they integrate ESG when they present to the SuperFund trustees, while every manager is also required to provide an annual stewardship report.

“Non-compliance or matters of concern are tracked and reported on a regular basis. Should a manager not take appropriate action to address concerns within a reasonable period of time, the relevant portfolios may be removed from the offering.”

Hacking adds that the SuperFund also seeks to collaborate with industry stakeholders to develop, share and promote best practise in ESG. Old Mutual and the SuperFund are also taking a leading role in engaging with business and policy makers on strategic macro issues, he says. “We have recently been involved in collaboration efforts between retirement funds and asset managers regarding these matters.”

The Future

As to the future, he says the SuperFund will continue to focus of driving down costs and the improvement in value for members. Another priority is to educate and counsel members around the advantages of preserving their retirement savings when they change jobs. Most of all however, the focus is on navigating through the uncertainty posed by the pandemic.

“The long and short-term impacts of the pandemic on investment markets here and abroad will remain a challenge that the SA pension sector will have to carefully navigate.”

Key takeaways:

  • Credible research suggests that companies with diverse teams make better decisions and crucially make for better investments.
  • Our voting and engagement policy encourages companies to increase the participation of women and ethnically diverse candidates at senior levels by growing and encouraging a diverse talent pipeline.
  • We also push for improvements in diversity and inclusion-related disclosures and strategies.

It is now widely understood that diverse groups make better decisions because they are less likely to suffer from the ‘group-think’ which can lead to sub-optimal decision making. More recent research goes further and suggests a causal link between greater diversity and stronger financial performance where diversity is achieved at a sufficient level and is normatively accepted.1

Diversity is a lead indicator of wider corporate culture. We are all aware of companies failing because the board is populated with directors unwilling, or unable, to challenge a single domineering personality. As investors, we may not know what goes on behind closed doors, but we still need to be able to evaluate corporate culture. Often, we glean insights into the effectiveness of a company’s decision-making processes and the health of its corporate culture from a combination of scrutinizing published information and, critically, via engagement meetings.

Our voting and engagement policy has two aims. First, we aim to encourage companies to increase the participation of women and ethnically diverse candidates at senior levels by growing and encouraging a diverse talent pipeline. We also aim to improve diversity and inclusion-related disclosures and strategies where a company has a diversity strategy but disclosure is limited, or where a company has an insufficiently rigorous diversity strategy.

In order to determine how we vote, we study a company’s publicly disclosed diversity and inclusion policies. We expect a company to disclose openly its diversity and inclusion policies and practices, not just in relation to gender but encompassing a wider understanding of diversity and inclusion. We expect to find this on the company’s corporate website, and on its careers page, as well as in its annual report or corporate social responsibility report. We also consider the gender split of a company’s board, and any other workforce data that has been disclosed. When examining workforce data, we believe it is appropriate to split our policy geographically to account for regional differences.

Data is often scarce and incomplete in relation to diversity across an entire company. Gender diversity at the board level is a data point which is accessible to investors. But, at an executive or management level, data is often unavailable or inconsistent, which leaves us as investors with insufficient information to make meaningful comparisons.

Obtaining Data on Ethnic Diversity Can Be Challenging

We face additional challenges obtaining data on ethnic diversity within companies, and data provision varies significantly between regions. The European Union General Data Protection Regulation (GDPR) allows the collection of personal and ethnicity data for the purposes of equality monitoring, but in practice it is often difficult to source the data. It must be proved that the information is collated legally, which requires individuals to consent. This explains why ethnic diversity data provision across Europe is often patchy. Where it is collected, the information often pertains only to a small group of individuals, rather than to all employees. There may also be country-specific legal and practical challenges. For example, in Germany, census forms do not allow for identification of ethnicity, and limitations on data collection exist in France.

At present, the lack of consistent data surrounding ethnic diversity within companies is an obstacle to our making fully informed voting decisions. Nevertheless, ethnic diversity is a key consideration for us – both when researching companies, and in our stewardship activities. Where ethnic diversity data is disclosed, as is often the case in the US, this forms part of our analysis of a company when researching it for investment and engagements.

Constructive Engagement

Our approach is designed to facilitate a constructive engagement with companies on diversity and inclusion. Via our engagement, we ask that companies interpret diversity in its broadest sense, considering, for example, ethnic and socio-economic diversity. We also explain, where we need to do so, that diversity can make a positive contribution to a company and its long-term resilience. We believe firmly that diversity cannot be a tick-box exercise. The benefits of diversity can only be realized where companies are truly diverse across a range of factors, from gender and ethnicity to socio-economic and professional backgrounds, resulting in cognitive diversity, and diversity of thought.

Initiatives to Accelerate the Pace of Change

We also participate in a range of initiatives designed to accelerate the pace of change. We are active members of the 30% Club Investor Group. In 2020, this group expanded its targets from focusing solely on gender to also encouraging UK company boards and executive committees to include one person of color by 2023.2 Our work with this initiative has included engaging with proxy advisers on the range of data which is collected on diversity, with a focus on ethnicity. These discussions were intended to highlight a number of practical insights, such as the specific data that can be collected, what the challenges are, how this varies by region, and how this landscape is evolving. We welcome the recent update from proxy voting provider ISS3 that it is now highlighting Russell 3000 and S&P 500 companies with no apparent racial or ethnic diversity, and that it will recommend taking voting action from 2022. We also welcome Glass Lewis’s collection and disclosure of ethnic diversity data for S&P 500 companies.4

We are also members of the Workforce Disclosure Initiative (WDI), and use this as a platform to enhance the management of human capital and engage with companies on social issues, and to advocate the need for improved disclosures.

Finally, as the quality and coverage of diversity data expands beyond gender diversity at the board level, we expect to evolve our voting policy to encompass other aspects of diversity such as ethnicity more explicitly.

Sources

Sources

  1. McKinsey https://www.mckinsey.com/business-functions/organization/our-insights/delivering-through-diversity
  2. 30% Club – https://30percentclub.org/press-releases/view/ten-years-on-30-club-uk-sets-new-targets
  3. ISS – https://www.issgovernance.com/iss-announces-2021-benchmark-policy-updates/
  4. Glass Lewis – https://www.glasslewis.com/nasdaq-rule-highlights-evolving-expectations-on-board-diversity/
Important information and disclosures

Important Information

This is a financial promotion. Issued by Newton Investment Management Limited, The Bank of New York Mellon Centre, 160 Queen Victoria Street, London, EC4V 4LA. Newton Investment Management Limited is authorized and regulated by the Financial Conduct Authority, 12 Endeavour Square, London, E20 1JN and is a subsidiary of The Bank of New York Mellon Corporation. ‘Newton’ and/or ‘Newton Investment Management’ brand refers to Newton Investment Management Limited. Newton is registered in England No. 01371973. VAT registration number GB: 577 7181 95. Newton is registered with the SEC as an investment adviser under the Investment Advisers Act of 1940. Newton’s investment business is described in Form ADV, Part 1 and 2, which can be obtained from the SEC.gov website or obtained upon request. Material in this publication is for general information only. The opinions expressed in this document are those of Newton and should not be construed as investment advice or recommendations for any purchase or sale of any specific security or commodity. Certain information contained herein is based on outside sources believed to be reliable, but its accuracy is not guaranteed. You should consult your advisor to determine whether any particular investment strategy is appropriate. This material is for institutional investors only.

Personnel of certain of our BNY Mellon affiliates may act as: (i) registered representatives of BNY Mellon Securities Corporation (in its capacity as a registered broker-dealer) to offer securities, (ii) officers of the Bank of New York Mellon (a New York chartered bank) to offer bank-maintained collective investment funds, and (iii) Associated Persons of BNY Mellon Securities Corporation (in its capacity as a registered investment adviser) to offer separately managed accounts managed by BNY Mellon Investment Management firms, including Newton and (iv) representatives of Newton Americas, a Division of BNY Mellon Securities Corporation, U.S. Distributor of Newton Investment Management Limited.

Unless you are notified to the contrary, the products and services mentioned are not insured by the FDIC (or by any governmental entity) and are not guaranteed by or obligations of The Bank of New York or any of its affiliates. The Bank of New York assumes no responsibility for the accuracy or completeness of the above data and disclaims all expressed or implied warranties in connection therewith. © 2020 The Bank of New York Company, Inc. All rights reserved.

In Canada, Newton Investment Management Limited is availing itself of the International Adviser Exemption (IAE) in the following Provinces: Alberta, British Columbia, Ontario and Quebec and the foreign commodity trading advisor exemption in Ontario. The IAE is in compliance with National Instrument 31-103, Registration Requirements, Exemptions and Ongoing Registrant Obligations.

Any reference to a specific security, country or sector should not be construed as a recommendation to buy or sell this security, country or sector. Please note that strategy holdings and positioning are subject to change without notice.

Capturing the opportunity in music copyright royalties.

Music copyright royalties are steadily gaining recognition as an investable market with long-term growth prospects underpinned by structural growth drivers, such as online music streaming. What’s more, this innovative asset class could offer investors access to more resilient income streams – people tend to tune in to listen to the latest hits and old favourites regardless of the macroeconomic backdrop. This paper discusses how targeting smaller, underutilised catalogues could also be key to capturing new revenue opportunities.

Disclosures and important information

For Investment Professionals only. Not for onward distribution. No other persons should rely on any information contained within. This guide reflects M&G’s present opinions reflecting current market conditions. They are subject to change without notice and involve a number of assumptions which may not prove valid. The distribution of this guide does not constitute an offer of, or solicitation for, a purchase or sale of any investment product or class of investment products, or to provide discretionary investment management services. These materials are not, and under no circumstances are to be construed as, an advertisement or a public offering of any securities or a solicitation of any offer to buy securities. It has been written for informational and educational purposes only and should not be considered as investment advice, a forecast or guarantee of future results, or as a recommendation of any security, strategy or investment product. Reference in this document to individual companies is included solely for the purpose of illustration and should not be construed as a recommendation to buy or sell the same. Information is derived from proprietary and non-proprietary sources which have not been independently verified for accuracy or completeness. While M&G Investments believes the information to be accurate and reliable, we do not claim or have responsibility for its completeness, accuracy, or reliability. Statements of future expectations, estimates, projections, and other forward-looking statements are based on available information and management’s view as of the time of these statements. Accordingly, such statements are inherently speculative as they are based on assumptions which may involve known and unknown risks and uncertainties. Actual results, performance or events may differ materially from those expressed or implied in such statements. All forms of investments carry risks. Such investments may not be suitable for everyone. United States: M&G Investment Management Limited is registered as an investment adviser with the Securities and Exchange Commission of the United States of America under US laws, which differ from UK and FCA laws. Canada: upon receipt of these materials, each Canadian recipient will be deemed to have represented to M&G Investment Management Limited, that the investor is a ‘permitted client’ as such term is defined in National Instrument 31-103 Registration Requirements, Exemptions and Ongoing Registrant Obligations. Australia: M&G Investment Management Limited (MAGIM) and M&G Alternatives Investment Management Limited (MAGAIM) have received notification from the Australian Securities & Investments Commission that they can rely on the ASIC Class Order [CO 03/1099] exemption and are therefore permitted to market their investment strategies (including the offering and provision of discretionary investment management services) to wholesale clients in Australia without the requirement to hold an Australian financial services licence under the Corporations Act 2001 (Cth). MAGIM and MAGAIM are authorised and regulated by the Financial Conduct Authority under laws of the United Kingdom, which differ from Australian laws. Singapore: For Institutional Investors and Accredited Investors only. In Singapore, this financial promotion is issued by M&G Real Estate Asia Pte. Ltd. (Co. Reg. No. 200610218G) and/or M&G Investments (Singapore) Pte. Ltd. (Co. Reg. No. 201131425R), both regulated by the Monetary Authority of Singapore. Hong Kong: For Professional Investors only. In Hong Kong, this financial promotion is issued by M&G Investments (Hong Kong) Limited. Office: Unit 1002, LHT Tower, 31 Queen’s Road Central, Hong Kong. South Korea: For Qualified Professional Investors. China: on a cross-border basis only. Japan: M&G Investments Japan Co., Ltd., Investment Management Business Operator, Investment Advisory and Agency Business Operator, Type II Financial Instruments Business Operator, Director-General of the Kanto Local Finance Bureau (Kinsho) No. 2942Membership to Associations: Japan Investment Advisers Association, Type II Financial Instruments Firms Association. This document is provided to you for the purpose of providing information with respect to investment management by Company’s offshore group affiliates and neither provided for the purpose of solicitation of any securities nor intended for such solicitation of any securities. Pursuant to such the registrations above, the Company may: (1) provide agency and intermediary services for clients to enter into a discretionary investment management agreement or investment advisory agreement with any of the Offshore Group Affiliates; (2) directly enter into a discretionary investment management agreement with clients; or (3) solicit clients for investment into offshore collective investment scheme(s) managed by the Offshore Group Affiliate. Please refer to materials separately provided to you for specific risks and any fees relating to the discretionary investment management agreement and the investment into the offshore collective investment scheme(s). The Company will not charge any fees to clients with respect to ‘(1) and ‘(3) above. M&G Investments is a direct subsidiary of M&G plc, a company incorporated in the United Kingdom. M&G plc and its affiliated companies are not affiliated in any manner with Prudential Financial, Inc, a company whose principal place of business is in the United States of America or Prudential Plc, an international group incorporated in the United Kingdom. This financial promotion is issued by M&G International Investments S.A. in the EU and M&G Investment Management Limited elsewhere (unless otherwise stated). The registered office of M&G International Investments S.A. is 16, boulevard Royal, L-2449, Luxembourg. M&G Investment Management Limited is registered in England and Wales under number 936683, registered office 10 Fenchurch Avenue, London EC3M 5AG. M&G Investment Management Limited is authorised and regulated by the Financial Conduct Authority. M&G Real Estate Limited is registered in England and Wales under number 3852763 and is not authorised or regulated by the Financial Conduct Authority. M&G Real Estate Limited forms part of the M&G Group of companies.

The Global Pension Transparency Benchmark (GPTB) measured four factors in its assessment of transparency of pension fund disclosures, here Amanda White looks specifically at the level of cost transparency across pension funds globally.

Costs are a vital input into generating fund performance for members: they are measurable, manageable and certain.

Research based on CEM’s benchmarking database clearly shows that funds with cost-effective investment operations generate better net returns and value added than those that don’t. CEM says that clear and complete public disclosure of costs leads to better cost management.

However, when it comes to the transparency of cost disclosures for stakeholders the GPTB demonstrates there is much room for improvement.

While on average the 75 funds assessed in the GPTB ranked 68 for performance disclosure, the average for cost disclosure transparency was only 51, with individual fund scores exhibiting a huge range from 18-88.

The GPTB asked 57 cost questions across a range of criteria from total costs to external management costs and asset class level disclosure.

Of the 75 pension funds analysed in the GPTB, 88 per cent reported total costs. But looking a bit closer reveals that 70 per cent reported total costs when some external fees were included; and only 38 per cent of all funds reported total costs which included some transaction costs, usually brokerage commissions.

Work by CEM Benchmarking has previously shown that funds only report about half of their true total costs, which means tens of billions of dollars across the industry is not being reported. Transaction costs are probably the area that is most poorly disclosed.

In the benchmark analysis CEM says that all too often institutional investors only report costs that they pay explicitly (such as wire transfers) and do not report large costs incurred that are netted from assets under management. This is especially true for external management fees and transaction costs, which are typically the two most material costs for asset owners.

External management cost transparency was the hardest cost factor element to assess and score in the GPTB. This was due to the fact that external manager costs were often not identified separately, and assessment required imputing the extent of external management fees included in total fund costs. It is worth noting that disclosure reviews were also hampered by differences in accounting practices, which CEM says generally favoured form (how expenses are disbursed) over substance (directly netted expenses are usually excluded from the financial statements).
Of the funds analysed 27 per cent did not disclose or discuss any external management fees.

None of the funds reached the highest level of inclusion for private market asset classes, (detailing all costs and not netting rebates and other expenses).

And 20 per cent of all funds reported invoiced or paid expenses – of this group, 85 per cent disclosed implicit or directly netted expenses

The lowest scoring cost factor component was completeness of transaction costs (country average of 27), followed by asset mix cost disclosure (country average of 35).

Only 57 per cent of funds reported management expenses by asset class/option; 16 per cent reported performance fees separately; 32 per cent reported transaction costs by asset class/option; and 37 per cent reported asset class costs as a percentage of AUM, which is most helpful for context and comparability.

The Netherlands was the country that scored best for cost factor disclosure with a range across the five funds assessed of 71 to 88 and an average of 83. In fact, the top four scores were held by Dutch funds.

Mexico ranked the worst on cost disclosure with an average country score of 23 but Finland was not far behind with 28. Also, worth noting that while the US and Norway scored ok on average (41 and 42 respectively) they both had low minimum scores of 24 and 18, with Mexico’s minimum sitting at 19.

For all the analysis of the cost disclosure transparency and to see the fund’s that were highlighted as best practice examples, click here.

Transparency is discussed so much that the word almost seems to suffer semantic satiation in policy and politics, but transparency is not for transparency’s sake.

Public pensions and other private capital investors know that the real goal of transparency is measurement for the sake of good governance, benchmarking, forecasting, and more.

A few pensions have demonstrated extraordinary results as a result of equal effort, no doubt.  However, improved data standards for incoming reporting and a benchmark for pension disclosure is the two-part solution that will usher in constructive transparency.

Until then, pensions must contend with significant variation with incoming reporting and differences in statutory reporting requirements for their disclosures – differences that potentially create additional burdens on pensions.  A two-part solution that is like two sides of the same coin is needed to bring comparability and consistency to the incoming and outgoing reports.  Fortunately, there are a few pioneering efforts to accomplish just that.

Incoming data

As a former pension fund employee, the struggle for consistent and comparable data is something I came to understand well.  The operations and reporting teams at countless asset allocators, pensions included, spend significant time and resources to collect and “scrub” investment data.

The level of time and resources required to make incoming data consistent and comparative is not equivalent to the expected task difficulty, but the devil is in the details – or more specifically, the lack thereof.

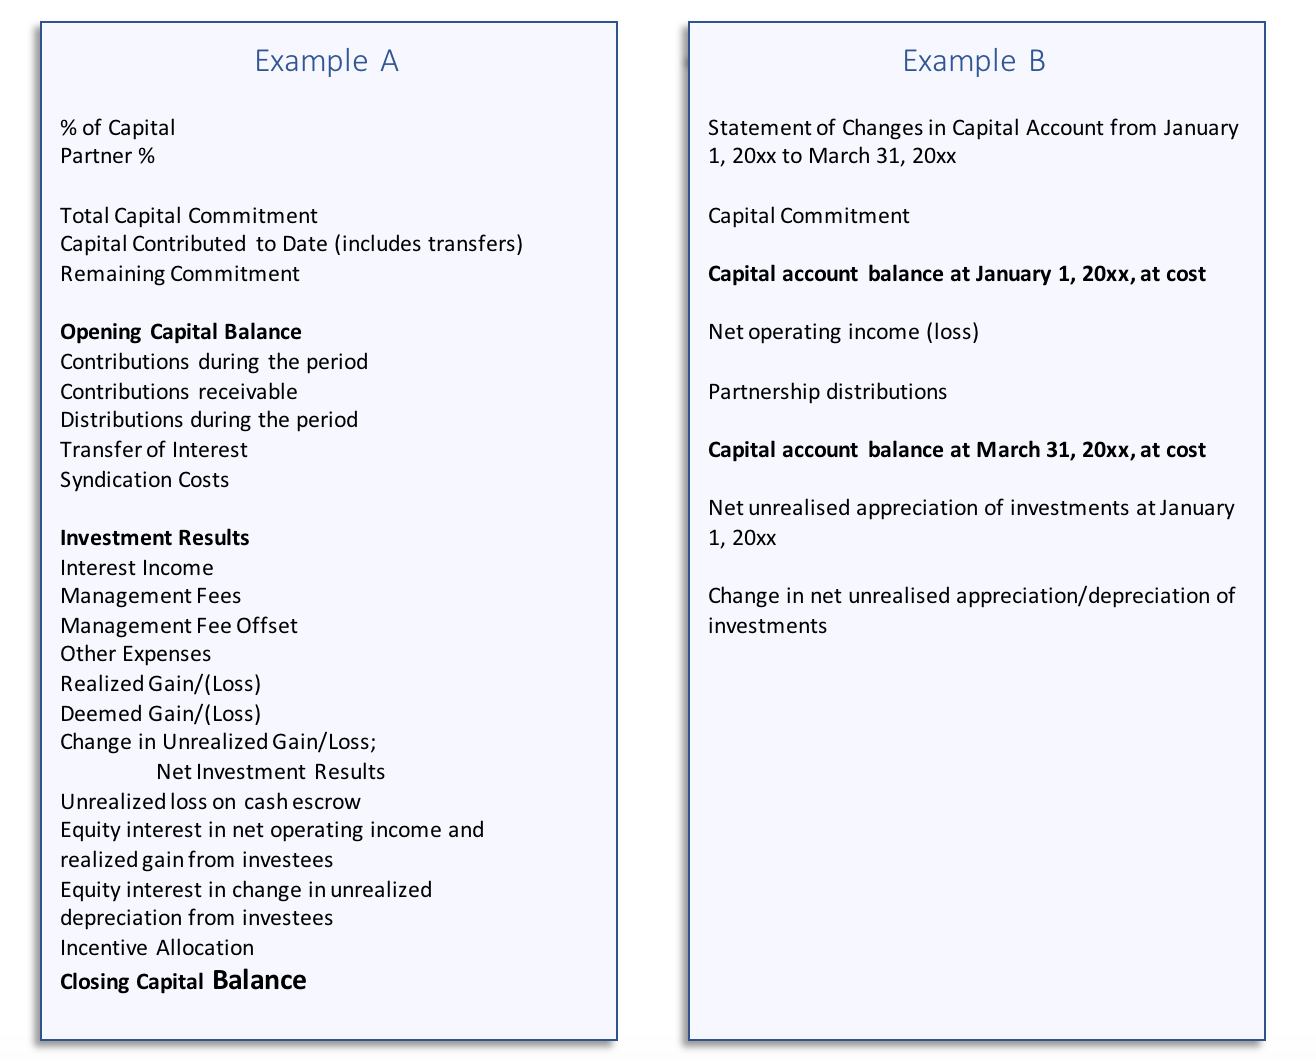
Automation is elusive because investor statement formats differ and the individual data points tend to be “apples to oranges” when it comes to comparability which hinders a simple data collection and aggregation.  (See below for a comparison of two actual statement formats).

Banks, technology, and service providers have invested millions for PDF-scraping, AI, machine learning, and more to speed up the data collection and aggregation.  However, incoming data needs an accepted global data standard (data tags) so that electronic reporting files can be automated easily and far more efficiently than PDFs or spreadsheets. The inefficiencies of the inputs, translate to uncertainty in the outputs.

Examples A and B are taken, line by line, from two private equity general partners’ (GPs’) quarterly capital account statements or “NAV statements” to their investors.  Example A is very granular, while Example B is more summarised.  Both statements communicate the same high-level information to the limited partner (LP).  However, for example are they both net of allocated incentive (aka carried interest)?  It is not clear in this example, and combining data from hundreds of different statements can make the same differences add up if the data is “apples-to-oranges”.

Outgoing data

All pensions investing in private capital contend with the inefficiencies described above and then depending on their jurisdiction, their requirements for disclosure can vary just as much.

Working for a US public pension, I found that nearly every other public pension in the US had a slightly different approach to their disclosures.

US public pensions prepare comprehensive annual financial reports (CAFRs) following the Governmental Accounting Standards Board guidelines, of course; however the disclosures for detailed investment costs were not specifically prescribed, and practices varied greatly.

A significant portion of my time each year was devoted to performing analysis and preparing responses to inaccurate comparisons of investment fees, incentive (such as carried interest), and expenses made in the press, reports, and research.  Our operations team did an exceptional job of identifying management fees, allocated incentive and performance fees, as well as fund expenses but in the media, our fund was often portrayed as having substantially higher costs only because our disclosure was more transparent.  The extra efforts were unavoidable but terribly inefficient.

The reality of inconsistency from incoming investment data and the different expectations for pension disclosures mixed with various disclosure practices among their peers creates a not-so-perfect storm for pensions.  However, the Global Pension Transparency Benchmark’s launch[1] may be our industry lighthouse for disclosure practices, and the Adopting Data Standards Initiative seeks to solve for the incoming data hurdles.  I am committed to both.


The Adopting Data Standards Initiative

ADS seeks to develop industry standards that will facilitate digital reporting in the free market for efficiency and transparency in the GP-LP relationship with an informed and realistic expected adoption timeline.  The proposed ADS data standards (coming 2021-2022) in financial reporting will provide a solid foundation for the free market to solve for all market participants’ higher technology and analytical needs.  ADS is a global non-profit, to develop #notanothertemplate, but electronic data reporting standards.  Data standards can best be described as a common reporting language of data tags, or labels, and accepted definitions that the industry can utilise to exchange reports electronically in a consumable format that works with any commercial technology or platform:  data interoperability.

Lorelei Graye, is president of the Adopting Data Standards Initiative and an advisory board member of the  Global Pension Transparency Benchmark.