
Why Transparency Matters
The Global Pension Transparency Benchmark is a world first global standard for pension disclosure, bringing a focus to transparency in a bid to improve pension outcomes for members.
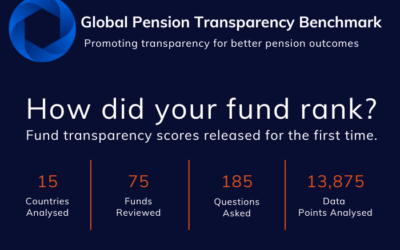
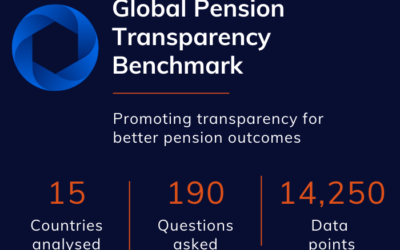
The GPTB ranks 15 countries on public disclosures of key value-generation elements for the five largest pension fund organisations within each country. The GPTB focuses on the transparency and quality of public disclosures with quality relating to the completeness, clarity, information value and comparability of disclosures.
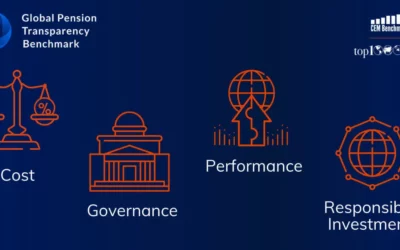
The overall country and fund scores look at four factors: governance and organisation; performance; costs; and responsible investing, which are measured by assessing hundreds of underlying components.
Countries Analysed
Funds Reviewed
Questions Asked
Data Points Analysed
There is plenty of evidence that a lack of transparency has negative consequences for relationships and organisations of all types, whether they be individuals, governments, corporations, or pension funds. Being transparent is the right thing to do, but there are many benefits beyond this simple moral imperative:
- Transparency and accountability go hand in hand and lead to improved decision making
- Improved relationships and interactions across a broad spectrum of stakeholders including beneficiaries, plan sponsors, regulators, suppliers and concerned citizens
- Ultimately, better outcomes through clarity of purpose, sound goals and accountability for progress

“A lack of transparency results in distrust and a deep sense of insecurity.” Dalai Lama
Select the year below to review the results from the current and previous GPTB projects.
You can also hover over countries, factors and methodology on the navigation bar to see the full results from the previous year.
Overall Findings 2023
The third edition of the Global Pension Transparency Benchmark reveals that increased scrutiny on public disclosures is driving measurable improvements. More than three-quarters (77%) of the reviewed organisations improved their total transparency scores. The average fund scored 60 out of 100, an improvement of five points relative to the last edition of the transparency benchmark. Four of the five transparency leaders increased their transparency the most: some have publicly declared their intent to be the most transparent pension organisations in the world.
It is great that the Global Pension Transparency Benchmark is driving organisations globally to improve their transparency.
Canadian funds finished first among the countries reviewed, with all five Canadian funds finishing within the top 10 funds globally. The Dutch funds also deserve an honourable mention. Collectively, they provided the best disclosures on cost and responsible investing.
CPP Investments topped the list of the most transparent funds in the last two editions of this benchmark. This year, they were narrowly beat out by the Government Pension Fund Global of Norway, and now form a competitive top three with the first three funds separated by only one point each. Australian Super rounds out the top three.
In the last edition of the benchmark, transparency scores for individual funds were published for the first time. This created more discussion. This year, we wanted to provide funds with more transparency on the review process. The process itself continues to improve as the benchmark matures. This year, additional governance was introduced, highlighted by a new appeals process for funds to dispute results.
Some of the improvements in this year’s transparency scores are driven by better processes and governance. Most of the improvements are driven by better disclosures.
While performance reporting at the fund level is generally well done, asset class level disclosures continue to disappoint.
More funds are quantifying their progress and goals around carbon footprint and other areas of responsible investing.
Stand alone reports on responsible investing are becoming more common, enabling funds to tell a cohesive story.
Cost disclosures continue to vary considerably by country and show a strong correlation to domestic disclosure standards.
Overall Findings 2022
This second iteration of the Global Pension Transparency Benchmark continues to reveal the need for improvement in pension transparency across the globe. Given the slow evolutionary nature of the pension industry in general, this is not an entirely surprising result.
It was heartening to see that progress is being made in some areas, particularly in respect to responsible investing, but also in governance disclosures.
The improvements seen in disclosures around responsible investing mean that this factor is no longer the lowest scoring factor. Improvements in governance disclosures mean that factor is now the highest scoring factor overall, followed by performance (the highest scoring factor in last year’s review), with cost being the lowest scoring factor.
For responsible investing, the improvements were most common among funds who were disclosing some, but not a lot of information last year. While some top scoring funds did improve on the margins, it was those funds in the middle of the rankings that showed the biggest improvement. Lamentably there was no improvement among the lowest scoring funds, 21 of which still received a score of 20 or below.
Governance scores reflected an increase in funds disclosing information about their operations as a whole, disclosing important corporate information beyond their core mission of managing assets. There was more discussion of enterprise-wide initiatives and goals, as well as increased discussion on internal compensation philosophies and diversity programs.
These two areas of improvement were often related. It seems that as pension organisations disclose more on how they steward portfolio companies, they are becoming aware that information of importance to them in this regard could similarly be of importance to their own stakeholders in relation to the fund itself.
While performance reporting at the fund level is generally well done, asset class level disclosures continue to disappoint.
More funds are quantifying their progress and goals around carbon footprint and other areas of responsible investing.
Stand alone reports on responsible investing are becoming more common, enabling funds to tell a cohesive story.
Cost disclosures continue to vary considerably by country and show a strong correlation to domestic disclosure standards.
Overall Findings 2021
The Global Pension Transparency Benchmark has revealed the need for serious improvement in pension transparency across the globe.
Overall the transparency of disclosure varies greatly, both between countries and between funds, across factors that were measured. In some instances there are wild variances between the best and worst performers.
While some countries and funds scored well on certain factors, on average transparency of disclosure needs improvement. Overall pension funds around the world scored best on performance disclosure, followed by governance, cost and responsible investment. But the average scores were low, with only the performance factor score demonstrating above average results (average country score of 68).
Transparency was best on the performance factor
Reporting around responsible investing lacks clarity and consistency
Within each factor there was a standout country
Cost factor disclosures varied considerably
Overall Results 2023
Country Results
| Country | Overall | Min | Avg | Max | Overall Ranking | Average Score (over) | Min - Max (over) | Cost | Min | Avg | Max | Cost Ranking | Average Score (cost) | Min - Max (cost) | Governance | Min | Avg | Max | Governance Ranking | Average Ranking (gov) | Min - Max (gov) | Performance | Min | Avg | Max | Performance Ranking | Average Score (perf) | Min - Max (perf) | Responsible Investing | Min | Avg | Max | Responsible Investing Ranking | Average Score (RI) | Min - Max (RI) |
|---|---|---|---|---|---|---|---|---|---|---|---|---|---|---|---|---|---|---|---|---|---|---|---|---|---|---|---|---|---|---|---|---|---|---|---|
| Australia | 63 | 74 | 87 | 3 | 74 | 63 - 87 | 55 | 65 | 69 | 3 | 65 | 55 - 69 | 87 | 93 | 100 | 2 | 93 | 87 - 100 | 64 | 77 | 90 | 3 | 77 | 64 - 90 | 53 | 68 | 85 | 8 | 68 | 53 - 85 | |||||
| Brazil | 42 | 48 | 56 | 12 | 48 | 42 - 56 | 45 | 52 | 58 | 9 | 52 | 45 - 58 | 42 | 60 | 72 | 11 | 60 | 42 - 72 | 43 | 59 | 66 | 11 | 0 | 43 - 66 | 15 | 28 | 46 | 14 | 28 | 15 - 46 | |||||
| Canada | 81 | 83 | 88 | 1 | 83 | 81 - 88 | 64 | 71 | 90 | 2 | 71 | 64 - 90 | 95 | 98 | 100 | 1 | 98 | 95 - 100 | 85 | 89 | 92 | 1 | 89 | 85 - 92 | 81 | 85 | 88 | 2 | 85 | 81 - 88 | |||||
| Chile | 39 | 47 | 53 | 13 | 47 | 39 - 53 | 45 | 54 | 59 | 8 | 54 | 45 - 59 | 57 | 64 | 71 | 10 | 64 | 57 - 71 | 39 | 50 | 59 | 14 | 50 | 39 - 59 | 11 | 26 | 44 | 15 | 26 | 11 - 44 | |||||
| Denmark | 54 | 61 | 67 | 7 | 61 | 54 - 67 | 24 | 39 | 57 | 13 | 39 | 24 - 57 | 71 | 83 | 95 | 4 | 83 | 71 - 95 | 41 | 54 | 68 | 13 | 54 | 41 - 68 | 70 | 76 | 84 | 5 | 76 | 70 - 84 | |||||
| Finland | 46 | 59 | 64 | 8 | 59 | 46 - 64 | 14 | 26 | 39 | 14 | 26 | 14 - 39 | 58 | 76 | 87 | 6 | 76 | 58 - 87 | 60 | 63 | 67 | 8 | 63 | 60 - 67 | 57 | 79 | 93 | 4 | 79 | 57 - 93 | |||||
| Japan | 35 | 46 | 66 | 14 | 46 | 35 - 66 | 29 | 40 | 54 | 12 | 40 | 29 - 54 | 39 | 49 | 64 | 14 | 49 | 39 - 64 | 51 | 67 | 85 | 5 | 67 | 51 - 85 | 12 | 34 | 73 | 11 | 34 | 12 - 73 | |||||
| Mexico | 11 | 30 | 40 | 15 | 30 | 11 - 40 | 7 | 15 | 20 | 15 | 15 | 7 - 20 | 11 | 45 | 73 | 15 | 45 | 11 - 73 | 21 | 32 | 49 | 15 | 32 | 21 - 49 | 3 | 32 | 77 | 13 | 32 | 3 - 77 | |||||
| Netherlands | 72 | 75 | 81 | 2 | 75 | 72 - 81 | 73 | 80 | 93 | 1 | 80 | 73 - 93 | 67 | 73 | 77 | 8 | 73 | 67 - 77 | 60 | 66 | 75 | 6 | 66 | 60 - 75 | 84 | 89 | 94 | 1 | 89 | 84 - 94 | |||||
| Norway | 40 | 59 | 89 | 8 | 59 | 40 - 89 | 15 | 45 | 91 | 11 | 45 | 15 - 91 | 39 | 71 | 89 | 9 | 71 | 39 - 89 | 33 | 62 | 95 | 9 | 62 | 33 - 95 | 48 | 69 | 94 | 7 | 69 | 48 - 94 | |||||
| South Africa | 43 | 55 | 63 | 11 | 55 | 43 - 63 | 40 | 46 | 50 | 10 | 46 | 40 - 50 | 59 | 76 | 89 | 6 | 76 | 59 - 89 | 45 | 64 | 82 | 7 | 64 | 45 - 82 | 3 | 33 | 54 | 12 | 33 | 3 - 54 | |||||
| Sweden | 67 | 72 | 78 | 4 | 72 | 67 - 78 | 50 | 58 | 64 | 5 | 58 | 50 - 64 | 79 | 87 | 92 | 3 | 87 | 79 - 92 | 60 | 68 | 82 | 4 | 68 | 60 - 82 | 73 | 82 | 90 | 3 | 82 | 73 - 90 | |||||
| Switzerland | 51 | 58 | 74 | 10 | 58 | 51 - 74 | 54 | 60 | 73 | 4 | 60 | 54 - 73 | 47 | 60 | 84 | 11 | 60 | 47 - 84 | 49 | 61 | 77 | 10 | 61 | 49 - 77 | 42 | 60 | 73 | 9 | 60 | 42 - 73 | |||||
| United Kingdom | 53 | 64 | 78 | 5 | 64 | 53 - 78 | 42 | 57 | 77 | 6 | 57 | 42 - 77 | 60 | 79 | 96 | 5 | 79 | 60 - 96 | 51 | 59 | 70 | 11 | 59 | 51 - 70 | 51 | 71 | 85 | 6 | 71 | 51 - 85 | |||||
| United States | 38 | 62 | 83 | 6 | 62 | 38 - 83 | 41 | 56 | 79 | 7 | 56 | 41 - 79 | 30 | 56 | 93 | 13 | 56 | 30 - 93 | 80 | 87 | 93 | 2 | 87 | 80 - 93 | 0 | 55 | 82 | 10 | 55 | 0 - 82 |
- Assessments were conducted between January 23 and May 5, 2023
- Where the scores are the same, a joint ranking has been awarded listed alphabetically
Year-on-Year Comparisons
Fund Results
- Assessments were conducted between January 23 and May 5, 2023
- Where the scores are the same, a joint ranking has been awarded listed alphabetically
Factor results
View data, rankings and analysis of each factors (cost, governance, performance and responsible investment)
Country results
View data, rankings and analysis of the 15 countries and underlying pension funds
Fund results
View data, rankings and analysis of the pension funds
Overall Results 2022
Country Results
| Country | Performance | Min | Avg | Max | Performance Ranking | Average Score (perf) | Min - Max (perf) | Cost | Min | Avg | Max | Cost Ranking | Average Score (cost) | Min - Max (cost) | Governance | Min | Avg | Max | Governance Ranking | Average Ranking (gov) | Min - Max (gov) | Responsible Investing | Min | Avg | Max | Responsible Investing Ranking | Average Score (RI) | Min - Max (RI) | Overall | Min | Avg | Max | Overall Ranking | Average Score (over) | Min - Max (over) | |
|---|---|---|---|---|---|---|---|---|---|---|---|---|---|---|---|---|---|---|---|---|---|---|---|---|---|---|---|---|---|---|---|---|---|---|---|---|
| Australia | 60 | 71 | 79 | 4 | 71 | 60 - 79 | 31 | 53 | 65 | 7 | 53 | 31 - 65 | 80 | 86 | 95 | 2 | 86 | 80 - 95 | 20 | 55 | 78 | 8 | 55 | 20 - 78 | 49 | 64 | 73 | 4 | 64 | 49 - 73 | 10 | |||||
| Brazil | 27 | 43 | 69 | 15 | 43 | 27 - 69 | 40 | 49 | 58 | 8 | 49 | 40 - 58 | 40 | 51 | 60 | 13 | 51 | 40 - 60 | 3 | 23 | 46 | 13 | 23 | 3 - 46 | 30 | 40 | 56 | 13 | 40 | 30 - 56 | ||||||
| Canada | 68 | 81 | 87 | 2 | 81 | 68 - 87 | 49 | 64 | 81 | 3 | 64 | 49 - 81 | 92 | 94 | 97 | 1 | 94 | 92 - 97 | 59 | 70 | 77 | 3 | 70 | 59 - 77 | 71 | 75 | 81 | 1 | 75 | 71 - 81 | ||||||
| Chile | 36 | 55 | 69 | 13 | 55 | 36 - 69 | 47 | 56 | 63 | 4 | 56 | 47 - 63 | 46 | 60 | 72 | 10 | 60 | 46 - 72 | 5 | 11 | 20 | 15 | 11 | 5 - 20 | 34 | 45 | 54 | 12 | 45 | 34 - 54 | ||||||
| Denmark | 38 | 56 | 70 | 12 | 56 | 38 - 70 | 20 | 45 | 65 | 9 | 45 | 20 - 65 | 69 | 78 | 93 | 4 | 78 | 69 - 93 | 65 | 68 | 74 | 4 | 68 | 65 - 74 | 52 | 60 | 67 | 5 | 60 | 52 - 67 | ||||||
| Finland | 45 | 62 | 70 | 6 | 62 | 45 - 70 | 21 | 27 | 43 | 14 | 27 | 21 - 43 | 49 | 73 | 87 | 6 | 73 | 49 - 87 | 14 | 67 | 88 | 5 | 67 | 14 - 88 | 31 | 55 | 65 | 8 | 55 | 31 - 65 | ||||||
| Japan | 35 | 56 | 83 | 11 | 56 | 35 - 83 | 26 | 36 | 54 | 13 | 36 | 26 - 54 | 32 | 46 | 63 | 14 | 46 | 32 - 63 | 0 | 23 | 67 | 12 | 23 | 0 - 67 | 23 | 39 | 62 | 14 | 39 | 23 - 62 | ||||||
| Mexico | 49 | 53 | 59 | 14 | 53 | 49 - 59 | 6 | 10 | 14 | 15 | 10 | 6 - 14 | 6 | 34 | 70 | 15 | 34 | 6 - 70 | 0 | 12 | 39 | 14 | 12 | 0 - 39 | 15 | 26 | 35 | 15 | 26 | 15 - 35 | ||||||
| Netherlands | 59 | 65 | 73 | 5 | 65 | 59 - 73 | 71 | 77 | 89 | 1 | 77 | 71 - 89 | 54 | 66 | 78 | 8 | 66 | 54 - 78 | 62 | 77 | 83 | 1 | 77 | 62 - 83 | 65 | 69 | 74 | 2 | 69 | 65 - 74 | ||||||
| Norway | 34 | 58 | 82 | 9 | 58 | 34 - 82 | 19 | 44 | 78 | 10 | 44 | 19 - 78 | 35 | 65 | 83 | 9 | 65 | 35 - 83 | 38 | 59 | 79 | 7 | 59 | 38 - 79 | 39 | 55 | 75 | 9 | 55 | 39 - 75 | ||||||
| South Africa | 55 | 62 | 79 | 7 | 62 | 55 - 79 | 36 | 42 | 51 | 12 | 42 | 36 - 51 | 49 | 68 | 84 | 7 | 68 | 49 - 84 | 17 | 47 | 67 | 9 | 47 | 17 - 67 | 49 | 56 | 64 | 7 | 56 | 49 - 64 | ||||||
| Sweden | 67 | 71 | 75 | 4 | 71 | 67 - 75 | 35 | 54 | 66 | 5 | 54 | 35 - 66 | 77 | 81 | 87 | 3 | 81 | 77 - 87 | 67 | 76 | 88 | 2 | 76 | 67 - 88 | 62 | 68 | 74 | 3 | 68 | 62 - 74 | ||||||
| Switzerland | 45 | 61 | 77 | 8 | 61 | 45 - 77 | 57 | 65 | 79 | 2 | 65 | 57 - 79 | 30 | 54 | 82 | 12 | 54 | 30 - 82 | 20 | 40 | 55 | 11 | 40 | 20 - 55 | 44 | 53 | 68 | 11 | 53 | 44 - 68 | ||||||
| United Kingdom | 52 | 57 | 66 | 10 | 57 | 52 - 66 | 32 | 53 | 74 | 6 | 53 | 32 - 74 | 57 | 73 | 90 | 5 | 73 | 57 - 90 | 33 | 60 | 75 | 6 | 60 | 33 - 75 | 48 | 59 | 70 | 6 | 59 | 48 - 70 | ||||||
| United States | 66 | 84 | 94 | 1 | 84 | 66 - 94 | 4 | 43 | 68 | 11 | 43 | 4 - 68 | 35 | 54 | 71 | 11 | 54 | 35 - 71 | 0 | 43 | 71 | 10 | 43 | 0 - 71 | 35 | 54 | 72 | 10 | 54 | 35 - 72 |
Year-on-Year Comparisons
Fund Results
- The fund assessments were conducted between August 1 -December 31, 2021
- Where the scores are the same, a joint ranking has been awarded listed alphabetically
*At the time of the review, QSuper was a standalone fund. It has since merged with Sunsuper to create Australian Retirement Trust.
Factor results
View data, rankings and analysis of each factors (cost, governance, performance and responsible investment)
Country results
View data, rankings and analysis of the 15 countries and underlying pension funds
Fund results
View data, rankings and analysis of the pension funds
Overall Results 2021
| Country | Performance | Min | Avg | Max | Performance Ranking | Average Score (perf) | Min - Max (perf) | Cost | Min | Avg | Max | Cost Ranking | Average Score (cost) | Min - Max (cost) | Governance | Min | Avg | Max | Governance Ranking | Average Ranking (gov) | Min - Max (gov) | Responsible Investing | Min | Avg | Max | Responsible Investing Ranking | Average Score (RI) | Min - Max (RI) | Overall | Min | Avg | Max | Overall Ranking | Average Score (over) | Min - Max (over) | |
|---|---|---|---|---|---|---|---|---|---|---|---|---|---|---|---|---|---|---|---|---|---|---|---|---|---|---|---|---|---|---|---|---|---|---|---|---|
| Australia | 66 | 76 | 86 | 4 | 76 | 66 - 86 | 58 | 67 | 84 | 3 | 67 | 58. - 84 | 65 | 72 | 80 | 2 | 72 | 65 - 80 | 8 | 46 | 70 | 46 | 8 - 70 | 50 | 65 | 79 | 8 | 65 | 50 - 79 | 10 | ||||||
| Brazil | 35 | 51 | 67 | 15 | 51 | 35 - 67 | 38 | 57 | 70 | 6 | 57 | 38 - 70 | 40 | 43 | 45 | 12 | 43 | 40 - 45 | 8 | 19 | 27 | 19 | 8 - 27 | 34 | 43 | 52 | 13 | 43 | 34 - 52 | |||||||
| Canada | 75 | 84 | 90 | 2 | 84 | 75 - 90 | 59 | 69 | 83 | 2 | 69 | 59 - 83 | 72 | 86 | 97 | 1 | 86 | 72 - 97 | 47 | 58 | 66 | 58 | 47 - 66 | 69 | 74 | 82 | 5 | 74 | 69 - 82 | |||||||
| Chile | 52 | 59 | 70 | 13 | 59 | 52 - 70 | 25 | 39 | 51 | 12 | 39 | 25 - 51 | 38 | 51 | 63 | 9 | 51 | 38 - 63 | 2 | 6 | 11 | 6 | 2 - 11 | 30 | 38 | 42 | 14 | 38 | 30 - 42 | |||||||
| Denmark | 51 | 61 | 70 | 12 | 61 | 51 - 70 | 41 | 51 | 59 | 8 | 51 | 41 - 59 | 47 | 63 | 91 | 4 | 63 | 47 - 91 | 46 | 61 | 74 | 61 | 46 - 74 | 55 | 59 | 68 | 3 | 59 | 55. - 68 | |||||||
| Finland | 64 | 69 | 77 | 7 | 69 | 64 - 77 | 18 | 28 | 31 | 14 | 28 | 18 - 31 | 38 | 57 | 71 | 7 | 57 | 38 - 71 | 13 | 58 | 81 | 58 | 13 - 81 | 33 | 53 | 63 | 4 | 53 | 33 - 63 | |||||||
| Japan | 47 | 69 | 86 | 8 | 69 | 47 - 86 | 30 | 38 | 46 | 13 | 38 | 30 - 46 | 18 | 28 | 41 | 14 | 28 | 18 - 41 | 0 | 20 | 40 | 20 | 0 - 40 | 24 | 39 | 48 | 12 | 39 | 24 - 48 | |||||||
| Mexico | 50 | 55 | 67 | 14 | 55 | 50 - 67 | 19 | 23 | 26 | 15 | 23 | 19 - 26 | 0 | 17 | 42 | 15 | 17 | 0 - 42 | 0 | 2 | 5 | 2 | 0 - 5 | 18 | 25 | 33 | 15 | 25 | 18 - 33 | |||||||
| Netherlands | 62 | 69 | 74 | 6 | 69 | 62 - 74 | 71 | 83 | 88 | 1 | 83 | 71 - 88 | 43 | 56 | 69 | 8 | 56 | 43 - 69 | 58 | 71 | 79 | 71 | 58. - 79 | 59 | 70 | 78 | 2 | 70 | 59 - 78 | |||||||
| Norway | 46 | 67 | 93 | 9 | 67 | 46 - 93 | 18 | 42 | 64 | 10 | 42 | 18 - 64 | 22 | 48 | 64 | 10 | 48 | 22 - 64 | 6 | 47 | 79 | 47 | 6 - 79 | 34 | 51 | 73 | 6 | 51 | 34 - 73 | |||||||
| South Africa | 56 | 66 | 80 | 11 | 66 | 56. - 80 | 34 | 46 | 63 | 9 | 46 | 34 - 63 | 43 | 60 | 77 | 6 | 60 | 43 - 77 | 8 | 40 | 57 | 40 | 8 - 57. | 44 | 53 | 63 | 9 | 53 | 44 - 63 | |||||||
| Sweden | 73 | 77 | 82 | 3 | 77 | 73 - 82 | 43 | 57 | 70 | 5 | 57 | 43 - 70 | 64 | 70 | 78 | 3 | 70 | 64 - 78 | 66 | 73 | 88 | 73 | 66 - 88 | 65 | 69 | 74 | 1 | 69 | 65 - 74 | |||||||
| Switzerland | 56 | 70 | 84 | 5 | 70 | 56. - 84 | 40 | 65 | 82 | 4 | 65 | 40 - 82 | 26 | 42 | 78 | 13 | 42 | 26 - 78 | 18 | 29 | 49 | 29 | 18 - 49 | 43 | 52 | 71 | 11 | 52 | 43 - 71 | |||||||
| United Kingdom | 61 | 66 | 76 | 10 | 66 | 61 - 76 | 42 | 56 | 71 | 7 | 56 | 42 - 71 | 48 | 63 | 86 | 5 | 63 | 48 - 86 | 24 | 47 | 63 | 47 | 24 - 63 | 50 | 58 | 65 | 7 | 58 | 50 - 65 | |||||||
| United States | 79 | 87 | 94 | 1 | 87 | 79 - 94 | 24 | 41 | 59 | 11 | 41 | 24 - 59 | 31 | 47 | 59 | 11 | 47 | 31 - 59 | 5 | 35 | 64 | 35 | 5 - 64 | 38 | 52 | 67 | 10 | 52 | 38 - 67 |
Factor results
View data, rankings and analysis of each factors (cost, governance, performance and responsible investment)
Country results
View data, rankings and analysis of the 15 countries and underlying pension funds
Insights
Norway SWF tops list of most transparent funds globally
Government Pension Fund Global, Norway’s giant sovereign wealth fund, has topped the list of the...
Canada, The Netherlands lead the way on pension transparency
Canada is a standout in the transparency of pension fund reporting, topping the list of countries...
GPTB 2023: The funds that excelled
The highest scoring funds overall in the 2023 Global Pension Transparency Benchmark were also...
Transparency improvements but more work needed on cost disclosure
Funds around the world improved their scores on responsible investment disclosure by more than on any of the three other factors assessed in the...

Funds need to evolve governance disclosures
While funds around the world do a good job of disclosing governance frameworks related to financial and investment risks, as revealed in the GPTB, but what is best practice for communicating governance around addressing large, one-off events such as the impact of COVID or war?
GPTB shows pension transparency improvement
The transparency of pension fund disclosures has improved in the past year across the 15 countries and 75 pension funds measured in the Global Pension Transparency Benchmark, a collaboration between Top1000funds.com and CEM Benchmarking.

Innovation needed on fund disclosure of corporate strategy
A minority of pension funds reviewed for the GPTB publicly disclosure their organizational strategy in a way that goes beyond disclosures of economic and market conditions and the impact on the performance of their investments. Michael Reid argues there is room for improvement in communicating key corporate activities to stakeholders.
Leads

Edsart Heuberger

Amanda White
Top1000funds.com
“We are passionate about improving the global pension industry and we think shining the light on these elements that drive value will do that”
Advisory Board

Keith Ambachtsheer
President, KPA Advisory Services; co-founder and board member, CEM

Fiona Dunsire
Not-for-profit board member

Lorelei Graye
Founder, Adopting Data Standards

Angélique Laskewitz
Director, Association of Investors for Sustainable Development

Neil Murphy
Vice-president, communications, Investment Management Corporation of Ontario

David Atkin, independent arbiter
Chief executive, PRI
Each esteemed member of the GPTB advisory board brings a unique perspective on the importance of transparency and reporting from all corners of the globe. Their feedback and ideas have been instrumental in developing this concept.
Please note, your details will be shared with both CEM and Top1000funds.com. Your data will never be shared with any other organisations or third parties.