Standards and expectations have moved quickly on ESG and sustainability reporting over the past four years, and the Hong Kong Exchange (HKEx) through its “Consultation Paper on Review of the ESG Reporting Guide and Related Listing Rules” has made an attempt to participate in this evolutionary process. This paper is an update to the exchange’s previous 2015 ESG guide, and while this step seems outwardly positive, we don’t believe it warrants an epaulette on HKEx’s shoulders?

We, the Asian Corporate Governance Association (ACGA), a not-for-profit membership association chartered under the laws of Hong Kong and founded in 1999, believe that the proposed amendments do not go far enough and will leave Hong Kong well behind leading practices in other regional markets, and globally. We feel that the exchange’s approach is incremental in key areas and highly “path dependent” (ie, constrained by the framework and content of the original guide). For an international financial centre like Hong Kong something more innovative and internationally minded is needed.

To help illustrate, there are three areas where the guide could provide additional guidance; 1) board statements, 2) climate change impact, and 3) international ESG reporting standards.

On board statements, the guide could provide additional language on how it could be made more meaningful to investors and other stakeholders (ie, company specific) and how to avoid boilerplate.

On climate change impact, the wording of the new general disclosure obligation and KPI is extremely brief.  This will probably result in boilerplate statements from companies. A more helpful approach would be to reference the logical framework provided by the Task Force on Climate-related Financial Disclosures (TCFD) and encourage companies to report in line with it.

On international ESG reporting standards, the guide mentions that issuers can opt to follow various international standards in ESG reporting, however, it does not incorporate practical guidance on these. We suggest looking at Sustainability Accounting Standards Boards (SASB) of the United States and “integrated thinking” approach of the UK for guidance.

There are also some policy issues that the guide could address. For example, on “comply or explain”, the presentation of the environmental and social KPIs could be read as implying that companies must gather and report on all these metrics, despite the fact that they fall under the “comply or explain” part of the guide. We suggest that a more explicit statement emphasising that companies should apply a materiality threshold to each KPI would be better.

On anti-corruption, the disclosure is positive, however, it is not properly supported by the Hong Kong CG Code which still leaves whistleblowing policy as only a “recommended best practice” (ie, not subject to comply or explain”). This is an area where the CG Code needs to be amended soon.

On ESG assurance, companies that choose not to seek assurance should perhaps be required to provide a detailed explanation of their data gathering and analysis process. We acknowledge that the Guide does address this issue to some extent but should be more explicit.

ACGA looks forward to the exchange taking a measured and responsible approach towards improving its guide. We are concerned that Hong Kong could suffer the same fate as many other Asian markets, namely sophisticated ESG/sustainability reports standing alongside mediocre and unchanging financial and corporate governance reports.

We highlight that this is a worsening issue in many places and is readily apparent from the 100-page GRI-style reports published by some companies (often large caps) alongside annual reports that contain limited narrative to their financial statements and CG reports that are cut-and-pasted from one year to the next. To conclude, the efforts to bring in higher standards in ESG reporting in Hong Kong are necessary, however, it should not result in a weakening in other areas of disclosure.

Bilal Khan is advocacy and data manager for the Asian Corporate Governance Association.


Dmytro Sheludchenko joined SEK 324 billion ($33 billion) Swedish pension fund AP1’s quantitative division in his mid-20s after graduating in maths and financial engineering, and a brief stint at Sweden’s Central Bank.

Now, aged 29, his position in the fund’s vibrant quant team underscores how leading pension funds are building internal young teams to embrace technology, look beyond short-term implementation to focus on long-term value, and draw expertise from the vast amounts of data in today’s new investment landscape.

“I used to be the youngest in the investment team, but I’ve younger colleagues now,” says Sheludchenko. “My time here has flown as we build up the internal portfolio of quantitative investment strategies in line with the fund’s decision to prioritize in-house expertise within this field.”

AP1 has allocated to factor strategies or risk premia for over a decade, but the portfolio of classic and alternative risk premia (ARP) across currencies, rates and equities is evolving and developing in what Sheludchenko calls a constant and on-going process.

Risk premia strategies in general have a low correlation with traditional asset classes and their liquidity gives a flexibility that makes the portfolio easy to scale up – or down, he says. Longer-term, structural changes are also afoot.

The buffer fund recently separated the portfolio into specific mandates, giving each a more dedicated role within the overall portfolio. Change has also focused on how the allocations are structured. For example, the fund has swapped its original focus on long/short equity factors to long only implementations.

“The portfolio used to be structured around classical ARP strategies in equities and other asset classes with several counterparties,” he explains. “But as time went on, we realised there is a better way for us to implement risk premia. For example, within equities we found that shorting single stocks is too expensive in the long run and ‘eats up’ much of the premia. But we still liked the equity factors so we dropped the short position.”

In another development, the fund has also decided to implement more equity strategies internally for cost reasons as well as to make better use of internal expertise.

During his tenure, the fund has also introduced leverage using derivatives backed by liquid assets to boost factor exposure in multi-asset trend following strategies.

“Our approach to leverage is not that different from what hedge funds do and is applied so that the factors reach an appropriate risk level in relation with to risk targets,” he says. “Our allocation to ARP strategies has resulted in a broader use of derivatives and led to higher requirements in risk management infrastructure to monitor and report risks.” 

Most recently, increased investment in infrastructure and data management means the internal team’s capability has grown again. Although some implementation is outsourced to partner banks because it is too complex and demanding to run in-house, AP1 still aims to design the portfolios and see for itself how they work.

“We can’t compete with the capacity of some of the large quant teams. However, we still want to be able to see how [the strategies] will perform, and we do this by building up robust infrastructure,” he says.

In another development, the growth of risk premia strategies has also led to a change in focus in the hedge fund allocation, bringing it in-house and moving away from Commodity Trading Advisor (CTA) structures.

“Our hedge funds now focus on strategies that offer more alpha and approaches that can’t be replicated in systematic factor fashion. The risk premia and hedge fund allocations are very complimentary – although I would say the hedge fund allocation is even more sophisticated than we are.”

Much of Sheludchenko’s role centres on developing expectations for the different allocations prior to actual investment, followed by rigorous comparison of investment outcomes compared to those initial expectations.

“For us the most important part of investment follow-up is to check if the historically observed ex-ante properties and expectations are met,” he says. It is this, rather than returns, that test a strategy’s success, as analysis of last year’s poorly performing trend strategies illustrates.

“The allocation did badly, as the whole CTA industry did, but that was entirely in line with our expectations. It was actually what we wanted,” he said.

Indeed, measuring success not on profits or loss, but on the basis of the portfolio doing what it is expected and predicted to do, is one of the aspects of the job he enjoys most.

“When we look at our performance it’s not really in the context of good or bad. Instead we ask if that performance was in line with our expectations and decisions. Think of it as ordering an expresso and making sure you get an expresso,” he explains.

That process involves shutting out day-to-day market noise like macro news and Central Bank briefings, as well as resisting the compulsion to check strategies’ performance on a daily basis.

“Our focus is on the global picture; if we are getting what we expected to get and if the portfolio performance is contributing to the overall performance in the way we defined.”

It’s a hunt for precision when the range of outcomes and uncertainty are so wide that made quants a “natural fit” with his maths background, he says, noting however that “sometimes things can’t ever be explained – even from a maths perspective.”

The job demands keeping up with the latest developments in academia and current thinking; checking what others in the field are doing and if it could be applied to AP1. Recently this has led Sheludchenko to explore new factors and results from combining different factor definitions, as well as ensuring current definitions are economically sound and correspond to what is expected.

“We still have a long way to go to include more alternative risk premia in more traditional portfolio framework,” he concludes.

Photo of Patrik Nyman and Dmytro Sheludchenko (left).


The California Public Employees Retirement System, CalPERS, is set for a root and branch reform of its governance structure that could cut the number of investment committee meetings to six from today’s 13, and reduce the size of the investment committee from 13 to a smaller, sub-team of nine.

The proposed changes, which also include reducing the annual number of offsites from two to one, were discussed at length during the pension fund’s August governance committee meeting and follows the completion of the $350 billion pension fund’s biannual governance review.

“CalPERS needs to innovate to keep pace with the challenges we face. That’s not easy, but it’s necessary. Our board is united by our fiduciary duty to our members. They deserve the best from us, and that includes governing in the most efficient and effective way possible. I’m proud that we have taken up the challenge of improving our governance – raising the bar for ourselves – so we can perform to the very best of our ability on behalf of the nearly two million members we serve,” said board president Henry Jones in a written comment to Top1000funds.com.

The year-long review found much to praise in CalPERS current governance, singling out board members unwavering commitment, diversity and the organisation’s transparency. Yet the process, which drew on expertise from the National Association of Corporate Directors, NACD, for insight and best practice on current governance thinking, and was also informed by CalPERS’ own 13-member full board via frank conversations and confidential surveys, also revealed gaps and areas to focus.

Better clarification of board members different roles and a richer program of board education, plus a need to re-draft policies and documents in plain English to make them accessible to all and prioritise agenda items, are all suggested areas for change. The review also stressed the importance of introducing new technology and building a code of conduct and culture of respect and trust among board members to preserve the confidentiality of their deliberations.

Fewer meetings

Most crucially, however, the review highlighted the meeting and reporting burden the current system places on CalPERS already stretched investment staff.

“If we make the governance better, we expect this is going to help CalPERS improve its performance,” said Anne Simpson, director board governance and strategy at the fund, who has overseen the review process and relayed its key recommendations to the gathered board members.

“The investment office currently has a cycle of meeting reports which is distracting from their day job of focusing on performance.  There is such concern to get the focus on performance when we are underfunded,” she said. The pension fund is around 70 per cent funded.

Fewer meeting would give investment staff more time in between meetings, and the investment committee more time for oversight.

“For every minute we spend here, there are hours spent by staff preparing for the work we are going to be presented with,” said board member Lisa Middleton. Every board meeting requires “time away from the regular work for Ben (Meng) and his team. None of those documents come to us without a review chain with loops and refinenment and revisions. It’s a massive amount of time and effort. I want Ben and his term focused like lasers on making that 7 per cent target or better,” she said. CalPERS posted a 6.7 per cent return in the fiscal year ending June 30, missing its 7 per cent assumed rate of return.

An argument seconded by new board member Stacie Olivares, who said in her experience most investment committee meetings are quarterly – even public boards.

“Providing information that the board needs, especially in times of economic uncertainty is challenging,” she said. “I do think it’s very critical to the performance of the CalPERS fund that the investment team be able to focus.” She noted how under the current system, three out of a typical month of 20 working days are currently spent attending board meetings. Add the prep and follow-up and it could take out an entire week, she said.

Expert committee

In another key change, the review findings suggest paring down the investment committee so that it is no longer a “committee of the whole” (as in the whole 13-member board) but a smaller, more expert group. The investment committee is the only CalPERS committee that all board members sit on; most other committees, such as the governance committee, have seven members.

This reduced, expert sub-committee would scrutinise investment issues in depth which would then go on for approval and discussion at full board level, strengthening due diligence in a two-step process that measured twice, and cut once.

“The concept of committees came about as a way of decentralising. Committees of the whole is almost like an oxymoron,” explained NACD’s governance consultant Cari Dominguez. “Most boards committees meet four to five times a year and I am not aware of any board having a committee of the whole as a leading practice.”

One of the challenges of a committee of the whole board is that there might be a tendency to defer to those with expertise, she said.

“Investment is the most important committee in many respects but in practical terms we don’t have an investment committee,” echoed board member David Miller, a proponent for the change. “We have a board. We need a sub-committee for all the reasons you have a sub-committee.”

Miller also suggested a different forum could lead to more constructive dialogue. CalPERS board sit on a raised crescent-shaped platform from where they scrutinize the pension fund’s staff.

Alarm bells

However, for some board members, the prospect of fewer investment committee meetings, and a smaller committee at the fund which manages just under half its portfolio internally, was a cause for alarm.

Under the proposed new structure, reducing the investment committee of the whole to nine would result in four observers, leaving some current investment board members “second class citizens for the most important role,” said Margaret Brown, in a passionate response.

“This is a terrible idea. There is real work to be done. This board has an obligation to provide oversight. We delegate work to the staff, but we keep the authority and we have the responsibility, financial responsibility, personally, for what happens. As an observer you have no motions and no vote.”

Brown also argued that monthly investment committee meetings had served CalPERS well and that the biggest challenge for the pension fund is low staff numbers, and high staff, and asset manager, turnover.

“You’ve got the cause and effect wrong,” she told colleagues. “Monthly meetings for the investment committee have been going for ever and have never impacted our returns.”

Reducing the size of the investment committee sat uneasily with others too. Flagging that the transition could be hard, board member Betty Yee suggested that those not serving on the investment committee wouldn’t be so engaged, diminishing the “bread and butter” role of CalPERS board.

“I want to give the investment staff as much breathing room as possible, but I don’t want to be taken for granted,” she said. “Our expertise leads to richer decisions.”

Elsewhere, board member Jason Perez also argued to keep the current set up lest it “erode the authority and responsibility” the board have to its members.”

The discussions closed with the governance committee approving fewer meetings and a smaller committee.

The funded status of corporate DB pension plans has experienced unprecedented volatility in the 21stcentury. This paper examines the sources of funded status volatility seen over the past two decades and discusses how plan sponsors of DB pension plans have adapted.  Numerous pension de-risking techniques are available for plan sponsors to use depending on their risk exposure and risk tolerance. It should be noted that risk management, by definition, can be a risky business and we will cover the pros and cons of several popular de-risking mechanisms.

The accompanying surplus/deficit chart tells the story. It shows the history of the Milliman 100 Monthly Pension Funding Index (PFI), which measures the aggregate funded status of the 100 largest U.S. corporate DB pension plans.

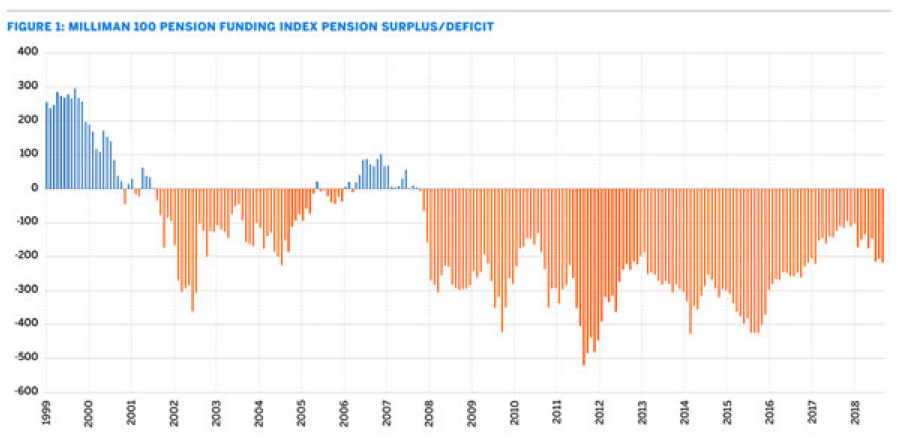
The chart shows four distinct periods of surplus and deficit. When Milliman established the PFI in 1999, DB plans were generally in surplus positions and this observed surplus continued through the end of 2001. However, the Milliman 100 pension plans recorded a funded status deficit of $16 billion by early 2002, in the wake of the dot-com crash and the 9/11 terrorist attacks.

The ensuing period of deficit lasted until 2006, with the funded status deficit reaching $36 billion. An all too brief economic and funded-status recovery followed with the funded status surplus reaching $3 billion in 2008. This period of surplus was short-lived, as the Milliman 100 plans began their second distinct period of deficit positions in 2008, during the time of the worldwide global financial crisis, with the funded status deficit starting out at $7 billion. Those deficits have continued through the recession and beyond, exceeding a decade. This leads us to the current funded status deficit of $212 billion as of June 2019.

Taking a deeper dive into the liability and asset components of the balance sheet will give further insight into the funded status volatility. First, we can examine the benchmark corporate bond interest rates used to value the pension liabilities of the Milliman 100 plans. Fourteen out of the last 20 years have resulted in net decreases for the year in corporate bond interest rates. Over the past 20 years, our highest year-end discount rate of 7.70 per cent was observed at the end of 1999 while our lowest year-end discount rate stood at 3.53 per cent at the end of 2017.

Discount rates

Discount rates dropped for six consecutive years from year 2000 to 2005 inclusive. The discount rate for the Milliman 100 plans at the end of 2005 was 5.45 per cent. The next three years saw rises in discount rates, followed by years 2009 through 2012, when discount rates further plummeted, reaching 3.96 per cent by the end of 2012. Since 2012 we’ve had four further years of discount rate drops interspersed with three years of discount rate increases. In 2019 thus far, discount rates for the Milliman 100 plans have dropped 74 basis points to 3.45 per cent as of June 30, 2019.

To provide some perspective on discount rate movements and their resulting liability gains or losses, a pension plans’ duration is often calculated. The duration of liability calculation is specific to a particular plan’s expected benefit payments and the plan’s discount rate. As of June 2019, the discount rate for the Milliman 100 plans was 3.45 per cent. Under that discount rate environment, plans with short durations had a measure of roughly 12 while plans with long durations had a measure of roughly 20.

These duration measurements essentially tell us that for a swing of 100 basis points in discount rates, pension liabilities can be expected to change anywhere from 12 per cent to 20 per cent. With discount rates falling over 400 basis points over the past two decades, pension liabilities have increased over 60 per cent at a minimum, with some even doubling in present value.

With pension discount rates as measured by high-quality corporate bond interest rates having been below 5 per cent for essentially the last eight years, one wonders whether this is the new norm. While it’s not clear whether pension liabilities will ever experience consistent reductions again attributable to rising discount rates, we do have some hope coming from the other side of the balance sheet.

Asset returns

In 11 of the past 20 years, asset returns of the Milliman 100 plans have beaten return expectations. Also, in the past 20 years, the Milliman 100 plans have had only five years where negative returns were experienced. The two worst return years occurred in 2002 following the dot-com crash, where assets lost 11.5 per cent of their value, and in 2008 during the global financial crisis, where assets lost 21.2 per cent. Generally, in periods directly following those of crisis, asset returns have roared back making up for past losses.

Over the last decade, six of the last 10 years have seen the asset returns of the Milliman 100 plans exceeding their return expectations. The average annual asset return for the Milliman 100 plans over the last 10 years has been about 7.9 per cent. But this annual return hasn’t been enough to keep pace with rising liabilities during the same period due to dropping discount rates. Looking at the funded status deficit period from 2008 to 2019, cumulative asset returns have been about 82.5 per cent. However, discount rates have fallen by 335 basis points over that same period, more than offsetting investment gains as the funded status deficit worsened by $205 billion.

De-risking

How have DB pension plan sponsors survived during these times of funded status volatility? Aside from meeting minimum funding requirements and at times contributing beyond minimum requirements to put a dent in unfunded liabilities and/or build reserves, plan sponsors have been keeping a keen eye on pension risk management. Numerous pension de-risking solutions have come into play over the past 20 years and continue to be executed to help plan sponsors keep a handle on balance sheet exposures. As with any proposed solution, new risks may exist and risk reduction methods are no different. They have associated costs and some are more preferable to others, depending on a plan sponsor’s funding situation and overall risk tolerance.

The first step in a de-risking program is to understand the plan’s risk exposure. This is a matter of systematically working through the different categories of risk, which could include discount rates, investment return, participant longevity, and pension administration, to name a few. In each case, the plan sponsor needs to analyse how its plan’s specific exposure to risk impacts the balance sheet, pension expense, and cash contributions.

A second step involves determining the plan sponsor’s risk tolerance. Plan sponsors need to prioritise the risks they wish to mitigate. The appropriate de-risking solution will ultimately depend on the plan sponsor’s risk tolerance. This includes how much they are willing to pay for the risk reduction solution versus tolerating the risk internally, essentially leaving it unhedged.

A third step involves bringing a pension plan’s risk exposure to within an acceptable tolerance level as defined by the plan sponsor. Risk exposure needs to be examined on an individual company basis. On many companies’ balance sheets, the pension plan does not show up as a first-order-of-magnitude line item; thus, there may be less motivation to pursue certain de-risking strategies relative to another organization whose pension risk exposure is more dominant.

What strategy?

De-risking strategies encompass a wide spectrum of options, each having different focal points and costs. Over the past two decades, plan sponsors have executed a wide range of techniques, which have involved liability reductions, asset allocation optimization and return maximization, combined liability and asset tracking, plan size reductions, pension risk transfers, and plan terminations.

Plan liabilities can often be effectively controlled through changes to the plan design. After reviewing pay and service definitions, the plan formula, plan subsidies via optional forms of payment, and the overall benefit accrual pattern, actuaries can make recommendations to meet the sponsor’s de-risking objectives. Hybrid plans such as cash balance plans have replaced many of the traditional final average pay plans that have existed in the private sector. Variable annuity (VA) plans provide different nuances of cost sharing and benefit guarantees. Other employers dealt with rising liabilities by closing their plans to new entrants, with some going a step further by freezing accruals.

Cut equity

Plan sponsors have changed asset allocation over the past two decades, moving away from equities and more into fixed income. That’s a key signal toward investment risk reduction and overall plan de-risking. At the end of 2005, the Milliman 100 plans had asset allocations to equities of 62 per cent and fixed income allocations of 29 per cent. The most recent Milliman Pension Funding Study for corporate plans shows allocations to equities and fixed income at 31 per cent and 49 per cent, respectively. With the change in investment allocation has come an associated drop in return expectations for the Milliman 100 plans. Return expectations were as high as 9.4 per cent back in the year 2000 and have steadily decreased since then, coming down to 6.6 per cent in 2018.

LDI

Asset management strategies have also been developed to better track a pension plan’s liabilities, allowing the plan sponsor to protect and maintain a plan’s funded status. Liability-driven investment (LDI) strategies are the most well-known in this genre. LDI strategies are designed to significantly reduce the volatility of both a plan’s funded status and its contribution requirements, with the goal being to match the duration of the plan’s liabilities with that of the asset portfolio, which is generally composed of fixed income instruments.

Once fully implemented, a plan sponsor can be agnostic to changes in interest rates and investment returns as the value of the plan’s assets and liabilities would move in similar directions by design. LDI strategies may differentiate themselves by the use of derivatives. One such example may involve the use of interest rate swaps to perhaps increase the degree of interest rate risk protection. In practice it is impossible to achieve a perfect match between assets and liabilities.

Thus, it’s unlikely that plans will commit 100 per cent of their assets to an LDI strategy, especially those plans with ongoing accruals that require an equity allocation to keep pace with liability growth. Many plans have used funded status triggers to signal further asset allocation shifts into fixed income toward achieving LDI, a practice known as dynamic LDI.

Lump sum

For those plan sponsors with little to no pension risk tolerance or the relatively small subset of plans whose pension risk footprint is so large that the company is willing to pay almost any price to eliminate it, risk transfer strategies are at the heart of the solution. Two popular risk transfer strategies are lump sum windows and annuity purchases, the latter also known as pension buyouts.

While a lump sum can exist as a permanent plan design feature, many sponsors have executed lump sum windows over the past decade and there seems to be no end in sight. Recent guidance from the Internal Revenue Service (IRS) has opened up the possibility of lump sum offers to retired participants in addition to the usual candidates of terminated vested participants.

Offering a lump sum window or amending a plan to offer lump sums permanently are both designed to relieve the plan sponsor of future liability risk. While lump sum strategies transfer risk from the plan sponsor to the participant, annuity purchase strategies transfer risk from the plan sponsor to a third party.

Annuity purchases involve the transfer of pension assets and liabilities to an insurance company that is deemed by the plan’s fiduciaries to have a very low probability of default. Transferring liabilities to an insurance company can come at a significant cost relative to funding the plan on an ongoing basis. A plan sponsor typically uses a buy-out strategy to secure participant benefits when plan termination is on the horizon. A plan termination is essentially the ultimate third-party risk transfer strategy, and corporate plans have seen a number of plan exits over the past 20 years, more prevalent in some sectors than others.

De-risking the risk

Risk management deals with probabilities, not certainties. Therefore, it is important to understand that pension risk management strategies have their own implied risks associated with them. Sometimes, the risk can be explicit in the form of an increased cost. Other times, the risk may not reveal itself until further down the road from implementing a given strategy.

For example, lump sum window strategies can have several risks associated with them. They may include participant anti-selection, opportunity costs of plan assets leaving the plan, market interest rate movements that could affect the calculation and valuation of future lump sums, settlement accounting charges added to pension expense, and a drop in funded status and an associated increase in short-term required contributions. Other risks include an insufficient participant election rate making the cost of administering and executing the window high relative to the risk reduction achieved.

Annuity purchases also have several detractors in addition to their relatively higher cost compared with other pension de-risking strategies. Retired participant buyouts can actually add to a plan’s funded status volatility because the remaining plan liabilities will be longer duration and thus more sensitive to interest rate changes. Furthermore, for a plan seeking to fully terminate, a plan that has had a retiree buyout may sometimes not get as favorable a pricing quote from an insurance company because the remaining participant liabilities are more complex and riskier to handle.

Another item to consider is whether an organization would be better off in the long run maintaining a fully funded pension plan that is generating income and showing a surplus on their balance sheet instead of going through the expense of a voluntary plan termination. Moreover, changes in plan design can impact an organization’s ability to attract and retain the quality employees it needs to remain competitive.

For those plan sponsors who are considering paring down their DB plans and intend to offer replacement benefits through a DC plan, it is important to give thought to the kinds of replacement plans that are available in addition to risk-sharing levels between employer and employee. Moving to a DC plan that offers the same benefit replacement level as a DB plan will generally increase costs for a plan sponsor. Conversely, moving to a DB plan that offers a lower benefit replacement level may result in employee dissatisfaction and defection.

Risks also exist with respect to plans that already have pension surpluses. The following comments are also relevant in the event of an interest rate spike for a plan that is near fully funded status. A corporate plan’s overfunding does not get returned to the plan sponsor, unless the plan is terminated, and even then, there is the cost of risk transfer in the form of plan termination and in most situations, a hefty 50 per cent excise tax on remaining surplus assets. Thus, while it is prudent to fully fund a plan, the risk of overfunding does exist and plan sponsors must carefully plan out dynamic LDI strategies when their ultimate funded status goals are reached.

In summary, while plan sponsors have dealt with more than their fair share of pension volatility over the past two decades, there have certainly been many options available to help smooth the journey. While it is prudent for plan sponsors to monitor pension risk, it is important to exercise care in the strategy that is chosen and in the timing of implementation. Every pension de-risking strategy has its own pluses and minuses and most have associated embedded costs, whether implicit or explicit. Risk management strategies must be customised for organisations depending on risk tolerance and risk budget requirements. It’s not a one-size-fits-all approach and that’s what makes it both challenging and rewarding for pension actuaries as they work together with plan sponsors to help them achieve their plan objectives through design and prudent management.

Zorast Wadia is a principal and consulting actuary with the New York office of Milliman.

The board of the $154 billion Teacher Retirement System of Texas has approved changes to its strategic asset allocation as a result of its latest five-year study, increasing its allocation to private markets, risk parity and introducing leverage.

In addition to allocation changes, which focused on the illiquidity premia, the strategic asset allocation recommendations also focused on efficiency and more diversity across assets.

Allocation changes include a 1 per cent increase to each of the private market portfolios: private equity (now 14 per cent), real estate (15 per cent) and energy, natural resources and infrastructure (6 per cent).

In a bid to diversify away from equity risk, the new asset allocation increases US Treasuries by 5 per cent, increasing stable value hedge funds (up by 1 per cent to 5 per cent of total trust), and increasing risk parity, which has been part of the allocation since 2014, by 3 per cent to 8 per cent of the total trust.

The hedge fund allocations were re-jigged so the increase in the stable value hedge fund allocation was countered by a decrease in the directional hedge fund allocation to now 3 per cent of assets, down by 1 per cent. This sits in global equities and will have its benchmark changed to a global equity benchmark.

The fund also introduced leverage for the first time, with a -4 per cent target, which will primarily be used to acquire the US Treasuries exposure increase.

Talking about the leverage exposure, Matt Talbert, senior investment manager at TRS said the best assets to lever will vary over time. The performance of leverage will be benchmarked against a three-month LIBOR rate, as recommended by the fund’s consultant, Aon.

Talbert said other important considerations in terms of implementing leverage include internal infrastructure. The TRS investment management department has a 10-year track record in implementing derivatives and has a dedicated operating team. It currently has $30 billion in derivatives usage, and the leverage adds another $9 billion to that.

The fund also increased the allocation to cash by 1 per cent to reflect the need for extra cash arising from operational and liquidity needs, given the introduction of leverage and increase allocation to illiquid assets.

In addressing the investment management committee, Mohan Balachandran, senior managing director of asset allocation at TRS said global equities remained the highest allocation at the fund and was still the key driver of trust returns in the long run, but the asset allocation changes looked to add diversification.

Balachandran said the net results of the changes are that the expected return will increase by 25 per basis points from 6.97 to 7.23 per cent; expected volatility also rises slightly from 11.3 to 11.6 per cent; and the expected Sharpe Ratio increases, as risk-taking becomes more efficient, from 0.4 to 0.41.

“We are becoming a little bit more efficient in risk-taking, and even though we are adding in leverage, the actual risk of the trust comes down,” he said.

In the strategic asset allocation study, James Nield, chief risk officer at the fund said more than 50 risk metrics were examined, but there were five key risk metrics used to evaluate any changes in strategic asset allocation. The potential changes indicate overall improvement in these, he said:

·       The historical probability of three-year returns earning 7.25 per cent improved with these changes, increasing from 49 to 54 per cent probability

·       Volatility stayed the same at 7.7 per cent

·       Percentage of time that rolling three-year returns are negative improved from 16 to 13 per cent

·       The maximum drawdown stayed constant at 26 per cent

·       And the liquidity ratio declines from 1.9 to 1.8 but stays above the 1.5 threshold.

Nield also said while the fund reduced its allocation to global equities by 3 per cent in dollar terms, the actual risk contribution from global equity declined by 10 per cent, from 82 to 72 per cent VaR.

The changes also mean the percentage of the trust in active strategies declines by 2 per cent, although active still dominates at 86 per cent of the fund. The internal management increases primarily due to treasuries, by 1 per cent to 35 per cent of the total.

The fund will transition three of the larger changes over a six-month period, with US Treasuries, global inflation linked bonds, risk parity all transitioning slowly.

The pace of the transition will not be set in advance, rather the benchmark weight will be set to the actual allocation at the end of each month, allowing an early end of the transition if investments can be added to it faster than the six-month period.

Texas Teachers has returned 10.8 per cent for the past 10 years, against a benchmark of 10.3 per cent.