Why even good inclusion and diversity (I&D) policies will miss their mark unless corporates have a better understanding of their employees.

Well-trained company management often tout that employees are their most valuable asset, that people are at the heart of who they are and that they have a strong corporate culture.

However, interest by management is often fleeting (“employee engagement survey, anyone?”), focus and policies tend to be weak and emotional intelligence tends to be low, that is they deal with people in ways that de-motivate. The optimist in me would like to believe that it’s not that leadership teams do not care. It’s just that designing effective top-down policies beyond pay and benefits that the average employee really cares about is really hard to do, especially for large companies.

This problem is made worse by the fact that very few organisations actually know who their employees are outside of the usual metrics of 70 per cent junior/mid-level, 25 per cent senior and 5 per cent really very senior.

One of my favourite lunchtime hobbies is to read Work Tribes in the FT. From egomaniacs to altruists, from the ‘sponsor-me’ guy to the ‘superwoman’, this satirical series allows readers to ‘listen in’ on the conversations of various characters in the workplace. Work Tribes is a little bit funny and somewhat indelicate, but behind some of the outrageous comments by ‘co-workers’ is an important lesson: in our workplaces we are surrounded by a unique blend of potentially weird yet wonderful individuals. Organisations need to make more deliberate strides to understand the identity of their workforce as a very basic first step in designing sensible engagement and inclusion and diversity (I&D) programmes.

Who are you? An object lesson in identity

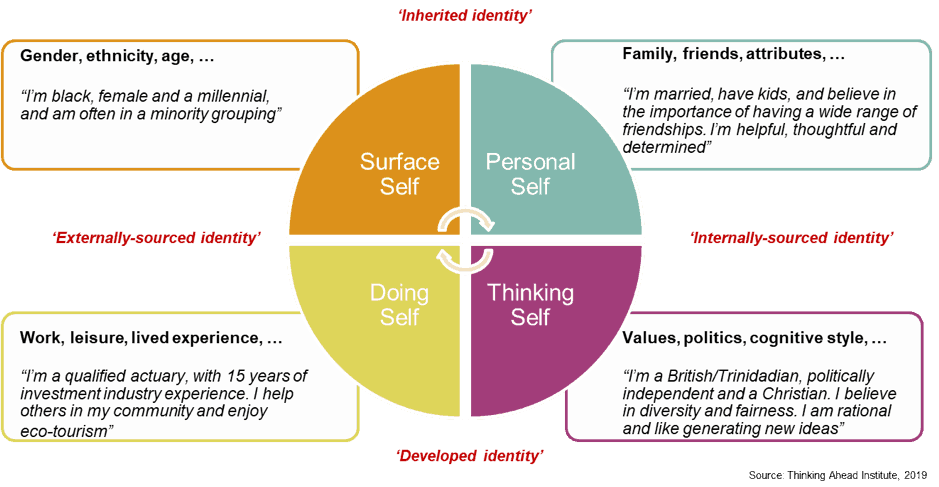
Imagine you are management and you have been asked to come up with some new I&D polices. You decide to be clever and sketch a map of the categories of individuals in your organisations. What does this map look like?  While there are many more categories that one could add, we can view work identity as very broadly made up of four basic ‘selfs’ (and if you dislike these labels, please substitute your own – you’re management after all).

  1. Surface self: this is probably best described as your inherent features which to greater or lesser extents are observable by others. Examples may be your gender, race, age etc. Because some of these features are easily identifiable, they often serve as the basis for both positive polices and discriminatory practices when set against a wider group that form the majority. Even for those features which may be less visible (such as some common disabilities), you are still at the mercy of policies that are not designed for you and have no chance of being so unless you make the difficult choice of disclosure.
  2. Personal self: like many parents with young kids I often feel as if I run parallel lives – diving in and out of meetings to attend school events and doing the mandatory clothing check to ensure there is no kid’s cereal on it before leaving the house. Many of us have relationships with friends, family, our pets etc that, at least for me, keep us grounded. We also have views on our personal attributes and how we think about ourselves (I’m kind, I’m helpful, I’m a hard worker etc). This sense of self-branding is important as it affects how we see the world and how the world might see us.
  3. Doing self: whether it be that you are a Liverpool fan, a volunteer at a homeless shelter, C-suite level (or all three), for better or for worse, society places currency on understanding what you do with your time. It is interesting that the weight of that currency often depends on whether or not individuals participate in traditionally defined workplaces or do something exciting (where’s an entrepreneur when you need one?). It is the lived experiences of individuals that count; the skills that you have accumulated in your journey regardless of the route taken. We need to be better at embracing the value of those who do not neatly fit into the corporate workplace box.
  4. Thinking self: focuses on often less visible areas such as your values and beliefs, how you think and your cognitive style. This category includes your religion, political associations and national (or tribal) identity. It can probably be summarised by ‘what I stand for’, ‘how I feel’ and ‘what I think’. This is where cognitive diversity gets most played out and offers the potential to see diversity in a deep way. Some of your beliefs will creep into how you feel about your surface, doing and personal selfs, reinforcing the reflexive and fluid nature of identity.

Feeling perhaps foolishly brave, here’s an example of my own work identity map.


It is worth noting here that no simple sketch could ever fully encapsulate our identity and describe who we are. There is also discretion applied to which aspects of our identity we share with others and which we keep to ourselves.

In filling my identity map, I found myself feeling limited by wanting to say more (what about my love of talk radio?) and wanting to portray myself in the most positive light (did I mention that I’m very very kind?).

But with a few prompts, it did manage to extract some key points about me and got me thinking about the difference between how society views me and how I view myself. This is echoed in Francis Fukuyama’s book Identity which compares extrinsic/societally imposed identity and that which is intrinsically/self-imposed.

Additionally, some aspects of my identity are inherited whereas others have been developed based on my experiences. The map also got me thinking that some aspects of my identity become exaggerated in certain situations. Just think about how you might feel if you were the only Asian person in a room or the only female, or when your minority self was disrespected. In short, the concept of identity is complicated and nuanced, but should be respected as it speaks to who we are.

A framework for employers: integrating identity into people policy

The historical approach of dealing with gender first, ethnicity second, disability third or whichever order suits the corporate agenda has lent itself to box-ticking and compartmentalisation of diversity factors.

Sometimes I feel like a tired mum, a hard worker, a sympathetic friend, an angry citizen, a black woman and/or all of the above. Is it fair for a corporate to tick me off as (i) female and (ii) black and then ignore the rest in a diversity checklist? And where in this model does the diversity of individuals who are white and male fit it?

Filling out my identity map reinforced the inadequacy of any approach which attempts to chop off bite-size identity pieces, and use these as a proxy to understand who I am. This doesn’t mean that corporates should not have initiatives around gender, ethnicity etc. It just means that leadership needs to recognise that these initiatives are only a small part of the whole-of-life employee experience.

The goals of organisations should instead focus on sympathetically combining three things:

  1. Building a diverse array of people that make up the organisation (this is ‘diversity’)
  2. Recognising identity (this is ‘respect’), and
  3. Treating people with decency (this is ‘inclusion’).

Consequently, leading to stronger value propositions for shareholders, employees, clients and wider society.

Diversity is clearly important to organisations. But before we can promote fairness and inclusion in our industry, organisations need a better understanding of who their employees are. One way of achieving this is to engage sensitively with employees and improve knowledge through the use of a framework like the identity map described above. In developing effective I&D policies, sufficient corporate energy should be squarely placed in allowing employees to voice who they are. Otherwise, even the most well-intentioned diversity policies will be destined for failure.

Marisa Hall is a director in the Thinking Ahead Group, an independent research team at Willis Towers Watson and executive to the Thinking Ahead Institute.


The $31.3 billion South Carolina Retirement System Investment Commission, RSIC, has launched a co-investment private equity program in a bid to reduce risk and enhance returns. Partnering with Chicago-headquartered GCM Grosvenor, RSIC will tap Grosvenor’s own private equity deal flow, as well as introductions to the manager’s GP network. The relationship will ultimately account for around 30-40 per cent of RSIC’s 9 per cent private equity allocation, and will also see Grosvenor help underwrite, review and ultimately speed-up RSIC’s investment with new GPs. The move underscores a wider trend among LPs, most notably CalPERS which is poised to restart a co-investment program for its $27.2 billion private equity portfolio, to invest more alongside GP partners.

“If we are looking at investing with a firm that is somewhat new to us, we will lean on Grosvenor and enlist their support in underwriting and reviewing the transaction. They will ultimately advise us on what we should do,” explains RSIC CIO, Geoffrey Berg.  “Aside from this, we will also benefit from having a partner that has their own deal flow, that we would not otherwise have access to. It will allow us to cast a wider net for future fund investments and get to know new GPs through the relationship they already have with Grosvenor.”

Within this pillar of the relationship RSIC is particularly hunting introductions to new GP names in the middle to smaller end of the market where the LP sees less flow. Only two months into the partnership Michael Hitchcock, RSIC’s chief executive, is already impressed with the quality of new introductions. “It’s not a story about what gets done in the first few months, but several co-investments are live right now and we are impressed with the GP interest in our platform,” he says.

The relationship means RSIC can respond swiftly to GP enquiries in the first come first served, competitive world of private equity. Grosvenor’s expertise and infrastructure allows RSIC to assess the quality of deals, conduct due diligence, build conviction and react to new GP enquiries much faster than what the fund’s small Columbia-based team can manage, says Hitchcock.

“We have our own lengthy due diligence that involves a deep quantitative analysis to understand how a potential GP adds value. As a result, we are able to react quickly when shown a co-investment by a GP we already know,” says Hitchcock. “However, for GPs that we may not already have a relationship with, the Grosvenor platform provides a way for us to respond with speed without sacrificing the quality of our due diligence, because Grosvenor can bring more resources to bear in a shorter period of time than we can.”

Risk

Another benefit is enhanced returns but without any additional risk to the private equity fund investment RSIC is co-investing alongside.

“Co-investments have no fee and no carry, or a greatly reduced fee and carry, and you can therefore increase your return by capturing the gross-net spread. When done in scale, it greatly reduces the cost of our overall private equity program,” says Hitchcock.

Indeed, the benefits of co-investment over fund investment was proven time and again in RSCI’s two-year analysis of thousands of transactions prior to the co-investment program’s June launch.

“We were trying to figure out reasons why co-investment might not be the right thing, but we found the case for co-investment far outweighed any other issues,” explains Berg. “We wanted to see if private equity co-investment returns are lower than the overall fund investments for a given GP. While we did encounter pockets of poor co-investment performance, it appeared to be GP-specific rather than a broader outcome.”

The co-investment program is also tailored to cap risk by limiting the bitesize of any individual investment to around $30 million.

“We could do more than $30 million, but that would be an exception to the rule. We want to avoid the big, idiosyncratic risk that comes from outsize exposure to a single transaction. Rather, we want a large number of transactions that allow us to tap into the gross net spread of the private equity beta. This programme isn’t about trying to hit home runs with any individual transaction,” says Berg.

Marriage not dates

Co-investment also sits comfortably with the kind of manager relationships RSIC’s seeks, where the mantra is long-term and creative.

“We look for marriage, not dates,” says Berg. “For us, it’s not just about a single fund investment. We are looking for a partner than can manage our money over multiple funds. When we conduct our underwriting process, we are not underwriting the funds, we are underwriting the firms.”

RSIC has 100-plus relationships and all strategy apart from cash and short duration is outsourced.

As the new program gathers steam, Hitchcock and Berg are turning their focus to other areas of the fund. This includes working with consultant Meketa Investment Group to explore the benefits, and possibility, of simplifying the asset allocation.

The fund currently has 17 asset classes with 22 benchmarks and the idea is to replace the top down structure with a more granular approach. For example, individual allocations to high yield, banks loans and emerging market local and hard currency debt, could be rolled into a simple fixed income or bond bucket. It’s a process that could lead to a change in the number of asset classes, says Hitchcock.

“We wouldn’t lose the ability to have exposure to the number of asset classes that we currently do, however, adding complexity to the portfolio would require conviction that it would add value over a more simplified approach.”

RSIC is also adjusting for the possibility of lower returns in a variety of ways. The equity allocation which was increased by 13 per cent in 2016 has now been tapered back again. After a “phenomenal track record” in real estate, RSIC is now putting more emphasis on core; similarly, in private debt the shift is away from more aggressive sub strategies like distress, junior lending and subordinated strategies, to secure direct lending.

The latest changes and innovation at the fund come against the backdrop of RSIC’s improved funded status. The two biggest pension plans are now 55 per cent and 63 per cent funded on an actuarial basis giving the plan a 63 per cent funded status overall. 2017 legislative changes which increased employer contributions, two good years of investment returns and a more realistic 7.25 per cent target return, likely be lowered to 7 per cent in 2020, have all helped, says Hitchcock.

“It’s challenging,” he admits. “But we are on the road to improvement.”

Concern about the negative impacts of plastic pollution has exploded in the last couple of years as more data has surfaced about the pervasiveness of plastic waste and our inability to control it, elevating concerns in the public consciousness, media, and government.  As You Sow, which has worked for more than a decade with activist investors to promote waste reduction and increase recycling of many types of waste, is working with a growing group of 40 investors to educate and engage companies and other investors about risks posed by plastic pollution.

Last June, As You Sow founded the Plastic Solutions Investor Alliance, an international coalition of investors engaging publicly traded consumer goods companies on plastic waste and pollution. So far 40 investors with a combined $2 trillion in assets under management have signed a declaration citing plastic pollution as a clear corporate brand risk and pledging to interact with leading companies to find solutions through new corporate commitments, programs, and policies. At this point, Plastic Solution Investor Alliance members are almost entirely money managers or ESG/SRI firms rather than asset owners.

While plastic has many beneficial uses, its production has grown exponentially for years without sufficient regard to its environmental impacts. Originally viewed as more of nuisance, plastic waste, especially discarded consumer packaging, is now understood as a widespread, growing risk to not just oceans, but air, climate, land, and human health.

Water: A key 2015 study estimated the ocean already holds 150 million tons of degraded plastic, with eight to 12 million tons added annually. Plastic production is projected to triple by 2050, yet only 14 per cent of plastic packaging is now collected for recycling.

Scientists predict oceans will contain more plastic than fish by 2050 if no action is taken. In rivers and oceans, plastic packaging breaks down into small indigestible particles that birds and marine animals mistake for food, resulting in illness and death.  In April, a sperm whale was found with 64 pounds of plastic in its stomach. Nearly 700 species have been affected, doing an estimated $13 billion damage to marine ecosystems. Plastic particles have been found in recent studies of tap and bottled water.

Land: Large amounts of plastic have been found in some of the most remote areas on earth, carried by ocean currents. Plastics have been consumed by land-based animals, including elephants, zebras, tigers, camels, cattle, and other large mammals.

Air: Plastic is becoming recognized as an atmospheric pollutant with recent reports of high levels of plastic particles in the air over the Pyrenees mountains in France.

Climate: Plastic is produced by fossil fuels and is therefore increasingly viewed as a contributor to climate change. If plastic production and use grows as projected by 2030, emissions could reach 1.3 gigatons per year—equivalent to the emissions released by nearly 300 new 500-megawatt coal-fired power plants.

Humans: A recent report from UK charity Tearfund linked poorly managed waste, including plastic, to human health impacts. It estimated that between 400,000 and 1 million people die annually in developing countries from illnesses and diseases like diarrhea, malaria, and cancers caused by living near uncollected plastic and other forms of solid waste pollution.

Companies putting plastic into commerce now face both regulatory and reputational risk. Regulators are starting to lead plastic reduction efforts. In March, the European parliament voted to ban single-use plastic cutlery, cotton buds, straws and stirrers. Seven US states have banned thin film plastic shopping bags. More than 100 countries have enacted some regulation of plastic bags. Britain is considering a tax on plastic packaging made with less than 30 per cent recycled content. On the reputational side, consumer brands face challenges from activists who collect branded waste in beach cleanups and call out the companies with the most waste.

Over the last five years, As You Sow has engaged fast food and consumer goods companies on single use plastic packaging. About 25 per cent of plastic is made into packaging, making it the largest use category. A lot of packaging is used for single use applications where materials are used briefly and then discarded in fast food and grocery applications. Though our engagement efforts, McDonald’s stopped using harmful polystyrene (styrofoam) cups and packaging globally, Starbucks agreed to phase out use of plastic straws, Pepsi allocated $10 million to increase recycling of plastic and other containers in the US; and Colgate, Kraft, Mondelez, P&G and Unilever agreed to make their plastic packaging recyclable.

This year we challenged several large plastics manufacturers to disclose spills of plastic pellets, which are posing a growing problem during production and transport. We reached agreement with ExxonMobil Chemical and Chevron Phillips Chemical.

We are also engaging four large consumer brands (Nestle, PepsiCo, P&G, and Unilever) to make plastic packaging recyclable, disclose annual plastic packaging use and set plastic use reduction goals. We are also asking they develop alternatives to plastic packaging where feasible, help fund collection and recycling in markets where they operate, and support new laws aimed at cutting plastic waste and broadening producer responsibility.

With growing risks to companies using single use plastics, investors will need to evaluate and place it in context with other large ESG risks such as climate, water pollution, and toxics. The mention of plastic in earnings calls increased by 340 per cent in 2018 from the previous year, according to MSCI research.  Citi and Morgan Stanley have begun to pay attention, issuing investor reports assessing the risks and opportunities to investors posed by plastic pollution.

The demonstrated environmental impact of single use plastic is a powerful symbol of the consequences of our convenience-oriented throwaway culture. If consumers begin to reject this culture in high numbers, financial impacts could be significant. Schroders recently estimated that soda companies that fail to reduce reliance on virgin plastics could see annual profits drop by 5 per cent over the next decade due to new laws and taxes.  If recycling is dramatically improved and laws reduce the amount of plastic allowed for single use applications, petrochemical demand growth could drop by a third of its historical pace, to about 1.5 per cent a year, according to consulting firm Accenture.

We believe that plastic waste has become so pervasive that the plastics industry and the companies that rely on it to deliver goods and services must eventually accept that problematic plastics need to be phased out. This will come at the same time that recycling for remaining plastics will be dramatically increased.

The investment community could help accelerate this transition if pension funds and other large investors step up and prioritise plastic pollution in engagement with companies and begin to publicly discuss it, as they did a decade ago on climate change.

Conrad MacKerron is founder of the As You Sow Corporate Social Responsibility Program.


Like anything, the brightest ideas in investment management invariably come from the most casual of conversations. Around 10 years ago, a team from AEW Capital Management, the Boston-based global real estate manager owned by French firm Natixis, went to meet executives for lunch at the $24 billion corporate pension fund for industrial group United Technologies Corportation (UTC) in their Hartford, Connecticut offices.

Conversation drifted from UTC’s 5 per cent real estate allocation made up of 30-odd properties in a core real estate mandate and various other fund investments with AEW, to observations on the growing demand for urban multifamily accommodation. It wasn’t long before UTC’s then director of pension benefits, Charles van Vleet, now CIO at aerospace and defence group Textron, commented that he was looking at a fund that specialised in the area.

“I said Charles, given our history of working together I think I know what you are looking for and we can structure the appropriate strategy. We wrote up the thesis and within two months it was on the table,” recalls Dan Bradley, a director at AEW. That idea has since developed into an allocation to value-add real estate that is currently UTC’s best performing asset class, posting five year returns of 22 per cent. With three successful projects under their belt, UTC and AEW recently launched a next phase to the strategy.

AEW’s pitch proposed a joint-venture whereby the manager and owner would develop, build and lease residential properties in high-income, densely populated coastal cities like California, New York and Miami. The strategy tapped into trends around land constraints and other barriers to entry, plus a preference for renting over home ownership and the growing number of empty nesters. It was also a creative and timely response to high property prices, which allowed UTC and AEW to build new units at a price point that was lower that what they could buy in the existing marketplace. The idea was that the units in the build-to-core allocation would ultimately result in well-leased properties which could migrate to the core real estate portfolio managed by AEW through a separate account. “The economics were compelling for developing as opposed to buying stabilized apartment properties with enough of a spread over average going-in capitalization rates,” says Bradley.

Although the basics of the strategy haven’t changed over the years, the friendship and trust on which it is based have evolved and strengthened to make this the cornerstone of the relationship. “This really is a people business,” says Joe Fazzino, UTC’s senior director of pension investments who has worked with AEW and Bradley throughout his 11-year tenure at the pension fund. Fazzino describes a friendship and respect cemented in early morning airport meets, shared drives out to properties to don hard hats and observe “the best and brightest” doing their job. “Real estate is a good asset class to get to know your manager. We’ve got bonds in the portfolio that are worth just as much, but you can’t see and touch them like you can property,” he says.

It’s nurtured an easy communication that is a large part of the strategy’s success, ensuring the manager and owner are always on the same page; know each other’s likes and dislikes from the right amount of yield and demand, to the perfect location and tenant profile. “We’ve developed a very good working relationship with them,” says Fazzino. “We are always on the phone talking about whether we have capital to deploy, if we are overweight or underweight and what we are thinking about the asset class.”

One important and dynamic element of that conversation centres around the use of leverage and how best to use, and stabilise, debt levels during the two to three-year build. The way AEW finances the build and acts strategically in today’s low rate environment but with an eye on rising rates in the future is a key part of the pension fund’s oversight. Fazzino, currently reducing the amount of leverage in the separate account side of the real estate portfolio, explains: “Leverage rates are important to us and we ask lots of questions around leverage. We are late in the cycle and we like to control leverage more than other investors.” Fazzino also oversees UTC’s 50 per cent allocation to fixed income.

An important part of UTC’s comfort (given the strategy’s markedly different approach to risk and reward vs conventional real estate) is rooted in an early decision to house the allocation in its private investment bucket. Rather than sit in the property allocation, it lies in an illiquid portfolio with LBO-type opportunities, a private debt allocation, and the private equity allocation which it particularly mirrors, explains Fazzino. “Capital is called, put into land and development, the property is improved upon, leased-up and ultimately sold. It’s like a private equity cycle and that J curve in private equity is something we see in this sleeve of the programme too.” Importantly, placing the allocation outside the pension fund’s real estate allocation also gave UTC more control, giving the pension fund “significant” input into strategy, he says. “It was a collective effort devising and structuring the strategy and this has allowed for alternative exit options that have achieved the goals and objectives we sought.”

The joint venture relationship is structured with a clear division of labour. AEW underwrites and oversees the acquisition process, provides inputs to the building design elements, provides project oversight and is the point of contact with the developer – who has typically secured a parcel of land and entitlements, designed the building and is looking for a large investor. The manager also does all the financials, administration and auditing of costs that go into the strategy and applies a belt and braces approach to risk mitigation around the development that includes countering cost overruns and environmental risk. “AEW is really in the weeds in terms of overseeing and controlling the project,” says Fazzino. “We meet and get to know the developer, but the developer’s relationship is with AEW: we provide most of the capital, AEW provides the management and investment oversight.”

AEW does, however, provide a slither of co-investment alongside UTC. It comes via a contribution from AEW’s most senior executives rooted in an initial stipulation when the strategy launched in 2013. “UTC asked that we put our own money in. Not much, but enough so that it was important,” says Bradley. “We would have done the same things, worked as hard as we did and had the same success, if we hadn’t had any co-investment,” says Bradley.

To date, UTC and AEW have built three multifamily developments totalling 902 units in Boston, Jersey City and Seattle. They’ve invested a total equity of $156 million with returns far exceeding expectations. Two of the investments have now migrated to sit in the core separate account portfolio but the duo decided to sell the Boston property. “We were really excited by very impressive investment returns. The market moved and the portfolio became worth so much we decided to sell that property,” says Fazzino.

Now the manager and pension fund are doubling down again in a new, second phase to the programme with UTC committing up to $190 million of new equity across five developments in expanded markets to include select edge-cities and suburban locations. “The fundamentals within these locations are favourable due to the lack of new housing and strong demand driven by aging baby boomers, coming of age millennials, stricter mortgage underwriting standards and traffic congestion,” concludes Bradley.


Almost exactly 30 years ago, a famous article by Michael Jensen in the Harvard Business Review predicted that private equity (meaning leveraged buyouts, not venture capital and other private equity) would “eclipse” the public corporation because it was a superior form of corporate ownership. Trends since 1989 seem to bear out Jensen’s prediction. The number of quoted companies in the US has fallen by more than one-half since it peaked around the turn of the century. Meanwhile private equity has seen huge growth: the number of companies owned by PE funds has risen from under 1,000 to over 20,000 in the US alone. Does this outcome show that private equity really is a superior form of ownership?

Private equity’s key feature is the way it makes company managers focus more single-mindedly on so- called “value creation”. Much time and energy has gone into studying whether private equity’s model does see companies being run better for investors. Progress has been made and most studies find positive results.

Yet, samples are usually relatively small; they rarely contain more than 300 companies under PE ownership. In addition, PE transactions create many layers of newly formed companies, which makes it hard to find the consolidated financial statements. In addition, and perhaps more crucially, accounting rules make it particularly difficult to tease out actual operating performance.

A common approach simply compares growth in revenue or profit with that of publicly traded companies in the same sector. But this is of little help if it is not scaled by the amount being invested in the company: higher levels of investment, both external and internal, will automatically see superior growth rates. This point has become increasingly relevant as more and more private equity firms pursue “buy and build” strategies.

This approach sees add-on acquisitions being layered onto an initial investment. These acquisitions are externally financed. Companies owned by private equity also increasingly have capital structures that allow them to reinvest in the business, rather than repaying debt as would have been the case 20 years ago. If publicly traded companies are less acquisitive and more prone to making shareholder payouts (share buybacks, dividends), then private equity owned companies will automatically grow faster, regardless of whether the private equity ownership model is delivering actual superior earnings growth.

Growth is only meaningful when it is scaled by investment. Measuring investment therefore becomes essential, but it is also surprisingly difficult. In principle, investment should be captured by the change in total assets. However, a buyout transaction usually triggers a one-time increase on the balance sheet in both tangible and (especially) intangible assets. This creates a discontinuity that distorts the change in total assets. In the first study on this topic, Kaplan (1989) acknowledges this issue and grosses up the pre-buyout total assets figure. Most academic studies since then have followed this approach.

However, both the buyout transaction and any add-on acquisitions affect the asset base in future years as well, via annual non-cash amortisation charges. Such charges see total assets being artificially reduced, year on year, and therefore bias return on assets upwards. It is possible to adjust the total assets figure for this issue by using footnotes in the annual accounts, but this is a time-consuming and laborious process which we are not aware anyone has attempted.

There are many other issues that can bias total assets, and therefore return on assets. For instance, a typical sale and lease back of real estate assets will result in an increase in reported return on assets even when there have been no real operational improvements. Other issues that can affect reported total assets include one-time non-cash impairment charges.

An alternative way to assess performance is to drop accounting-based approaches and simply look at the return realised by shareholders, i.e. gross of fees fund performance on individual deals. This means measuring all the cash invested by a private equity fund manager in a given portfolio company against the cash returned. This removes the need for any adjustments, but deal-level data is difficult to access because people who work in private equity choose to treat  it as confidential. Yet, any piece of evidence we have paints a consistent picture: gross of fees, returns are very high.

It is hard to say whether these high returns come from timing or negotiating skill (that is, buy low – sell high); from gearing up returns by using higher levels of debt at low cost; or from higher earnings growth, though. Knowing where the high returns come from is important because it informs about value creation at the level of society as a whole. If returns come from buying low or selling high, for instance, any value accruing to the private equity fund is merely being transferred from the sellers and buyers, respectively. No value has been created for society. When an increase in valuation (per unit of earnings) results from a consolidation strategy (“buy and build”), that may reflect real value being created, but it is not absolutely clear.

The situation is similar for debt. If returns come from accessing debt at low-cost, it is unclear that the associated value creation is beneficial for society as a whole. Some argue that high debt can benefit society because of the “discipline of debt.” The idea behind this is that high debt payments force operating managers to focus on earnings instead of wasting cash on personal perks and the like. But private equity already gives these managers sharp incentives to maximise profits. As a result, one may reasonably argue that higher debt levels are more likely motivated by corporate tax savings (which may result in lower taxpayer receipts) and to gear up returns.

The flip side of this gearing is that it can lead to a “debt overhang”. Suppose a company underperforms and gets close to missing debt payments. Its managers and other equity holders then have a sharp incentive to cut corners in order to keep control of the company until things turn around. This cost of financial distress is particularly worrisome in industries such as healthcare, childcare or care homes, where private equity has been investing significantly. Another concern involving debt is that although lenders provide about two-thirds of the capital that private equity firms invest, we do not know whether these lenders have received a fair risk-adjusted return over time. Since taxpayers stand behind many such lenders, a low return for them would mean an indirect subsidy from taxpayers.

The third source of returns (earnings growth) is perceived as the one that should translate into value creation for society as a whole. Yet, even that part may come at the cost of other stakeholders such as employees, competitors, consumers and suppliers. Measuring private equity’s value creation across society as a whole is, therefore, very challenging.

Finally, the growth in private equity may affect society’s income distribution. The largest group of end-investors in private equity consists of millions of pension scheme members. Even if private equity’s focus on “value creation” succeeds in growing the overall economic pie, a disproportionate share of that growth might stay with the private equity fund managers rather than passing to the end-investors and other stakeholders. Similarly, one of the attractions of private equity for senior operating managers is that they can earn significantly more than they can at quoted companies. Private equity firms are willing to pay life-changing rewards to a few individuals who can move the needle in terms of “value creation”. Meanwhile, the majority of employees may see their earnings being squeezed and their livelihoods and pensions put at risk by higher debt levels.

Private equity does not live down to the most negative images that its opponents invoke. But neither should its positive self-promotion be taken at face value. The new US legislation on private equity that Senator Elizabeth Warren has recently proposed shows that many people do not buy the official story. Some ambitious recent studies (e.g. Davis et al., 2019) have made significant progress on the issue of job creation and on private equity’s broader impact on society, but work in other areas is still needed. Thirty years after Jensen’s article, we believe the jury is still out. There is no proof yet that private equity in its current form is a superior form of ownership.

Peter Morris is an associate scholar Oxford University’s Saïd Business School. Ludovic Phalippou is professor of financial economics at Saïd Business School.


Pædagogernes Pension, PBU, the €9.5 billion ($10.5 billion) Danish defined contribution scheme for early childhood teachers is in the process of consolidating and reducing the number of managers in its listed equity portfolio. The decision at the fund which has around 10 large, focused equity mandates is linked to an ambition to reduce the number of companies in the portfolio in the belief that fewer companies in the 42 per cent equity allocation which is all actively managed allows greater ESG oversight.

“We don’t know how many managers we will end up with in listed equity yet, but we will have fewer in the years to come than what we have now. Only this way can we be sufficiently knowledgeable about our portfolio,” explains CIO Carsten Warren Petersen who was promoted to CIO last year after previous roles heading up equity and credit at the Copenhagen-based pension fund and is currently in the process of reaching out to PBU’s manager cohort.

The new strategy is being driven by PBU’s switch in focus to ensure all its managers have an ESG dimension rather than just focus on risk adjusted returns. New mandates will be allocated in line with a manager’s ESG credentials and ability to engage with companies on specific ESG factors. Petersen is also looking for heightened engagement between managers and the fund, he explains.

“We are asking our managers for a much more integrated approach between them and us. We want to be informed to a higher degree than before: when they invest in a company, we want to know what they are doing in terms of active ownership and if they are truly knowledgeable about that company in terms of ESG.”

The approach also reflects the fund’s ambition to have more control over ESG integration – and take more responsibility.

“You can’t hide behind an external manager. You need to know what is going on and what type of companies are in the portfolio. We want to be able to truthfully call ourselves a responsible investor; this means we need to know more about where we are invested which means fewer companies and fewer managers.”

Petersen is also thinking about how to apply the same strategy to PBU’s 40 per cent fixed income allocation that includes sovereign and corporate bonds. It is a more complicated process, however.

“It is a different ball game in terms of interaction between managers and companies in bonds compared to equities – managers’ contact with companies they are invested in is different on the debt side to the equity side.”

Influencing sovereign behaviour via government bond investment is also challenging. Although it’s possible to filter out sovereigns with for example poor human rights records, he says acting together with other investors is one approach. “Individual investors can reach out to a country but it’s very different to reaching out to a company. If investors want to influence a country, they must act with other investors to influence behaviour.”

Liquidity is key

PBU has small allocations to infrastructure and real estate, preferring instead listed, liquid markets where Petersen finds the agility he favours, and that allows him to work with the allocation if the market environment changes. “We adjust the portfolio according to market circumstances, so we have a high level of liquidity compared to our peers. We think we can create a well-diversified portfolio by having a large exposure to the listed space.”

Despite his eye on the late cycle and increased risk levels, he is not paring back the equity allocation which is weighted so that younger (the under 45s) savers have around 60 per cent of their portfolio in equity risk compared to older (the over 65s) where it hovers around 20 per cent.

“For the time being our view is that equity is still a good place to be – it has certainly benefited us over the past three years. Compared to others, on a risk adjusted basis we are in a good position and there is nowhere to hide until interest rates are higher.”

Asset valuations are impacted by low risk-free rates so that highly sensitive assets, particularly real estate and infrastructure, have increased significantly in value as rates have dropped, he explains.

“Alternative assets still yield a higher return than risk free rates but that reflects a higher risk, so investors are not hiding, but taking on other types of risk.”

The fund has returned 6.1 per cent on average since 2003.

He does note the impact of the ongoing trade war between the US and China hitting returns in the equity allocation. PBU has a 5 per cent allocation to mainland Chinese companies with a focus in large cap and small to mid-cap where the same stringent ESG criteria apply. He also notes the shift in supply chains by Chinese companies to new locations like Vietnam, having an impact.

“Companies are moving their supply chains and it takes time for things to run efficiently after reallocating.”

Petersen takes care to not deviate too far tactically from risk levels set by the board to ensure risk is set at the level beneficiaries expect.

“We have to be careful not to deviate too much tactically because otherwise we are no longer delivering the kind of risk we have indicated to beneficiaries.”

He is in the process of strengthening the fund’s quantitative risk analysis team which focuses on risk and portfolio construction. The current investment team is around seven-strong, but all allocations are outsourced, with the exception of the 9 per cent real estate allocation which is run in-house.