

It is often argued that an investor who is dissatisfied with a company’s ESG behaviour, and who wishes to remedy the situation, should stay on as a shareholder and engage with it. The reasoning is that when an investor divests, their influence over the company ceases. Moreover, the act of divesting is often presented as a passive approach that has no bearing on the company’s management, a capitulation rather than a form of action.
In a recently published paper (ESG Engagement and Divestment: Mutually Exclusive or Mutually Reinforcing?) we contend that both divestment and engagement are actions that promote change.
Divestment is a force of change when it directly and indirectly contributes to raising the cost of capital for divested companies: this limits their ability to invest in projects the investor deems harmful and gives their management an incentive to improve their ESG performance.
Lower share prices also reduce the value of management’s share-based remuneration, thereby giving top executives an incentive to integrate ESG considerations.
There is some uncertainty on what proportion of equity investors need to divest for the cost of capital to increase and some researchers have pointed to a proportion of more than 20 per cent, which would set a high bar for effective divestment campaigns.
Note however that the proportion of assets invested according to at least one type of ESG strategy has, by 2018, topped the 20 per cent bar in all developed equity markets except Japan (Global Sustainable Investment Review, 2018).
As two thirds of these ESG invested assets follow an ESG strategy that includes normative or negative/exclusionary screening it appears plausible that at least some industries have seen their cost of capital increase due to the implementation of large-scale divestment policies.
There is also some empirical evidence that the announcement of ESG-related divestments may negatively impact stock prices, both through direct impacts on share prices and indirect reputational impacts which participate in creating new norms.
The effectiveness of divestment campaigns, such as the fossil-free divestment movement, could be reinforced by a strong non-linear relationship between the proportion of investors that divest and the impact on share prices/cost of capital, through tipping points that suddenly break any linear relationship.
Properly managed and executed engagement can also contribute to improvement in the ESG performance of investee companies. The empirical results of academic studies thus indicate that both engagement and divestment approaches can be effective in achieving the desired ESG outcomes.
We also argue that these two strategies are entirely compatible: in particular, the rise of collaborative engagement campaigns, in which current and potential shareholders combine their forces, is testimony to the fact that divestment does not put an end to an investor’s possibility to engage with a company.
Divestment and engagement are hence not mutually exclusive.
And a shareholder who engages with a company without signalling a willingness to draw a red line – by exit in case engagement fails – will enter the negotiation in a weak position: the possibility of divestment is in that sense a prerequisite for effective engagement.
Conversely, engagement can make divestment campaigns more effective: noisy exits can be more impactful than silent ones. Therefore, far from being mutually exclusive, both engagement and divestment are mutually reinforcing.
Divestment is often wrongly reduced to two ESG-filtering-based strategies, namely norms-based screening and negative/exclusionary screening.
Proponents of ESG mixing strategies – ie so-called ESG integration strategies whereby ESG data and analysis are mixed with traditional financial inputs in the portfolio construction process – often claim that ESG mixing is more compatible with engagement than ESG filtering, on the grounds that ESG mixing does not lead to divesting.
However, contrary to common perception, ESG mixing strategies – such as over/underweighting based on ESG scores or using portfolio-average ESG scores as a constraint or objective in an optimiser – also lead to divesting based on ESG scores.
This is apparent in the two practical examples of investment processes that mix ESG data with market capitalisation weights and/or traditional factors (value, profitability etc.), which we will now study. And while ESG filtering sends unambiguous and predictable – and therefore actionable – signals to all companies, we will show that ESG mixing strategies send blurred – and therefore less effective – signals.
ESG mixing strategies
Compared with ESG filtering, ESG “reweighting” techniques lead to the divestment of companies with better ESG credentials and sends blurred signals.
One simple example of an ESG mixing strategy consists of applying an ESG tilt to index constituent weights. In the simple case where an ESG metric is used to tilt market-capitalisation weights, ESG reweighting leads to greater divesting from companies with better ESG performances than filtering would, to reach the same ESG target.
In the context of low-carbon strategies, for example, reweighting leads to divesting from companies that are less carbon-intensive than filtering would, for the same reduction in portfolio-weighted average carbon intensity.
To illustrate this point, in Figure 1 below we have ranked the companies in the Scientific Beta Developed equity universe at end 2019 in terms of carbon intensity (as per the definition endorsed by the Financial Stability Board, i.e. the ratio of a company’s Scope 1 and 2 emissions to its revenues).
We then compare the proportion of companies that needs to be impacted by the decarbonisation divesting scheme to reach the same decarbonisation target: all strategies achieve a similar level of weighted-average carbon intensity as the filtering out of the 5 per cent most carbon intensive companies, i.e. the same as a reweighting strategy where a 100 per cent weight reduction of the 5 per cent most carbon-intensive companies is permitted. The X-axis thus represents the severity of the reweighting allowed, the Y-axis plots the proportion of stocks affected by the partial divestment strategy in order to achieve the same carbon exposure reduction as the full divestment strategy. We also show the one-way turnover that the decarbonisation scheme entails to reach its target.
Figure 1: Proportion of stocks affected by divestment (%) and induced turnover (%), as a function of the weight reduction (%) allowed for carbon-intensive companies.
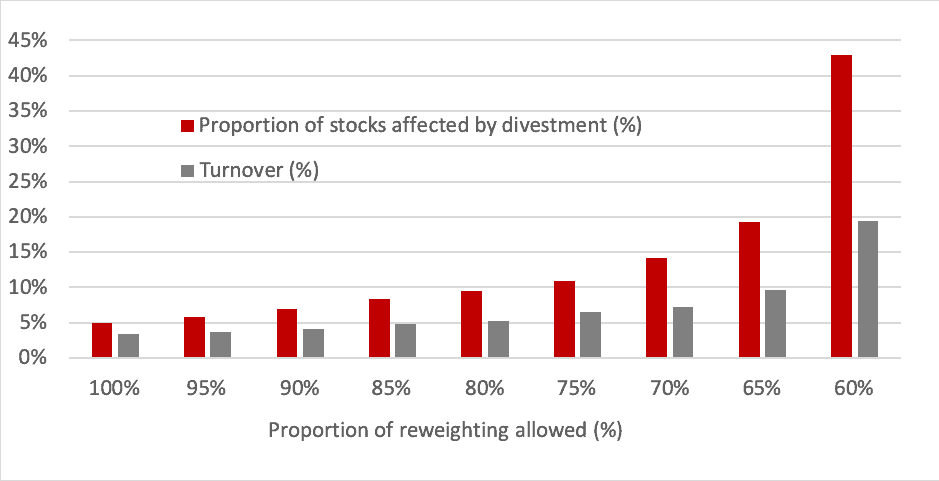 While the filtering strategy by construction leads to divesting the 5 per cent of stocks with the worst carbon intensities, the re-weighting strategy needs to divest from 43 per cent of the stocks if a 60 per cent weight reduction is allowed for, for example, in order to achieve the same level of weighted-average carbon intensity reduction.
By spreading out the divestment more thinly across more stocks, the price impact through which divestment is meant to influence companies’ behaviour will be less significant for the worst ESG performers. Moreover, contrary to a common perception that re-weighting is a less intrusive portfolio construction technique than filtering, re-weighting may induce a larger turnover to reach the same weighted-average decarbonisation target: while the filtering strategy creates a 3 per cent turnover, the re-weighting strategy with a 60 per cent weight reduction, for example, creates 19% turnover.
Another problem with such an approach is that, while divesting from high carbon emitters on average, the weight of a stock in a portfolio can increase over time if the stock is performing well relative to the others, irrespective of the carbon-intensity levels or change in carbon intensity.
To illustrate this point, we construct a portfolio that weights securities based on the product of market-cap and a carbon intensity score.
Table 1 provides the analysis that highlights the signalling problems with this score-weighting approach.
Firstly, while the weighted-average carbon intensity of this portfolio is reduced by 84 per cent relative to the cap-weighted index, on average over the five-year period we consider, the portfolio leads to problematic positions in individual stocks.
Indeed, it increases the weight over time towards more than 30% of the stocks that fall into the category of the “worst emitters”, i.e. 10 per cent of the stocks with the highest carbon intensity.
Table 1: Percentage of deteriorators and worst emitters receiving higher weights in score-weighted portfolio.
| Scientific Beta United States Carbon intensity * market cap weighted portfolio |
Percentage of deteriorators with increasing weight | Percentage of the worst emitters (10%) with increasing weight |
| 2015 | 47% | 41% |
| 2016 | 41% | 61% |
| 2017 | 48% | 44% |
| 2018 | 40% | 40% |
| 2019 | 48% | 33% |
The analysis is based on the Scientific Beta United States universe, from June 2014 to June 2019. Each June, we exclude coal stocks and classify the remaining stocks into deciles according to their carbon intensity over the previous year. Carbon intensity is the sum of scope 1 and scope 2 emissions divided by total revenue. Carbon stocks are the ones that (1) belong to the coal industry or derive turnover of at least 30 per cent from thermal coal mining, (2) belong to the utility industry, which makes significant use of coal in its power generation fuel mix (30 per cent), and (3) own coal reserves, except those in the iron and steel industry. The worst emitters are those classified within the highest decile, i.e. top 10 per cent after exclusion of coal companies. The deteriorators are those classified within a higher decile compared to the previous year. The reported figures correspond to the percentage of stocks among the worst emitters and deteriorators that have a higher weight in a score-weighted portfolio than in the previous. The score-weighted portfolio weights securities based on their score times the market-capitalisation. Scores are transformed into a cumulative distribution function of the normalised (truncated z-Score at 3 and -3) Carbon Intensity measures.
Moreover, while score-weighting clearly sends wrong signals to the worst emitters, it also happens to be the case when it comes to the firms that increase their carbon intensities.
We extend the previous analysis by focusing on firms that had significantly increased their carbon intensity relative to its equity universe. If a firm moves from one decile of carbon intensity to a higher decile, we refer to such firms as “deteriorators”.
Here again, the score-weighted portfolio would increase allocation to more than 40 per cen of the deteriorators. These illustrations above indicate that using firm-level scores to tilt towards low-carbon-intensity stocks leads to a blurred message to firms.
Yet another way to send mixed signals
The problem with score-based approaches is only magnified when multiple stock-level information is mixed, in particular when using portfolio-optimisation techniques to respect both ESG/low-carbon and factor exposure objectives.
Such approaches can lead to even greater increases in weights among the worst emitters. This is intuitive even without looking at the results, since optimisation will only care about the average carbon intensity across the portfolio.
Moreover, such mixing approaches also consider other stock-level characteristics, such as factor scores or contribution to tracking error. Pursuing the low carbon objective and other objectives simultaneously can lead to increasing weights to a firm even if its carbon emissions have become much worse over time.
To illustrate the point, we construct a stylised multi-factor portfolio that minimises the tracking error with respect to the broad cap-weighted index, while achieving a similar level of factor-score intensity (sum of individual factor scores) and carbon intensity to a low carbon smart beta strategy which simply excludes the 10 per cent worst emitters. In this illustration, this reference strategy is a low carbon HFI multi-beta 6-factor equal-weighted portfolio, constructed in a top-down manner on a decarbonised universe (excluding the worst 10 per cent emitters).
Unsurprisingly, the optimisation-based portfolio leads to a substantial reduction in weighted-average carbon intensity compared to the cap-weighted index.
During the period we consider, this reduction amounts to 74 per cent on average. Despite this reduction on average, the strategy leads to problematic weights in the worst-offending stocks. The results in table 2 confirm that the optimisation-based portfolio would increase the weight of the worst emitters quite often. For example, each year between 2016 and 2018, the optimisation-based portfolio allocated higher weight to more than 60 per cent of the stocks that were among the worst emitters in the universe. We also observe that, in certain years, allocation across more than 10 per cent of the worst emitters is higher than that of the cap-weighted index.
Table 2: Percentage of worst emitters receiving higher weights in optimisation-based portfolio.
| Scientific Beta United States Low Carbon/multi-factor optimisation-based portfolio |
Percentage of worst emitters (10%) with increasing weight | Percentage of worst emitters (10%) with higher weight than the Broad Cap-Weighted Index |
| 2015 | 18% | 2% |
| 2016 | 61% | 0% |
| 2017 | 69% | 4% |
| 2018 | 69% | 12% |
| 2019 | 17% | 10% |
For more details on this research, please refer to the following publication: ESG Engagement and Divestment: Mutually Exclusive or Mutually Reinforcing?
Erik Christiansen is an ESG and low carbon solutions specialist at Scientific Beta.


Leave a Comment
You must be logged in to post a comment.
Login