If the gold asset fits, wear it
The debate over gold’s value as a financial asset will always be intense. But investors should look past the rhetoric to the evidence, when making a decision about whether it’s right for their po
The debate over gold’s value as a financial asset will always be intense. But investors should look past the rhetoric to the evidence, when making a decision about whether it’s right for their po
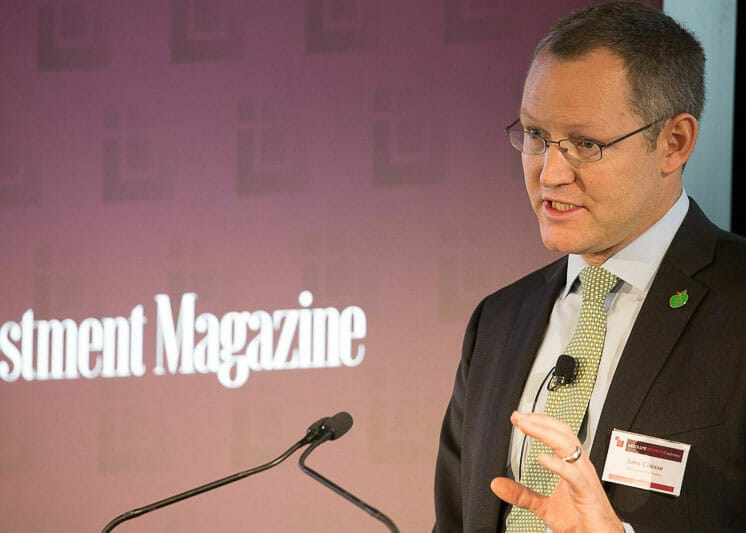
Albourne’s John Claisse says hedge funds must make more flexible arrangements with managers to survive and points to the ‘1 or 30’ model for its simple approach to putting the focus on alpha.
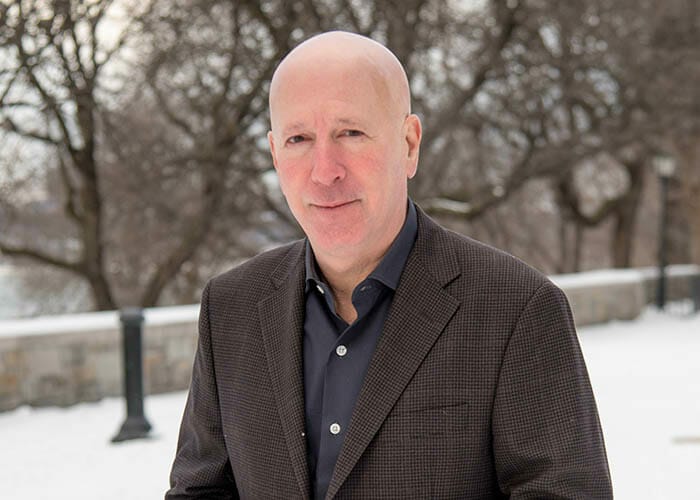
The University of California’s Rick Bookstaber argues that risk management should move from static equations to more realistic models in which outcomes depend on multiple agents.

The investment industry will need a new kind of leader with a new set of skills to serve the interests of younger generations and create value for society as a whole.

Human rights advocate Kerry Kennedy says ESG frameworks are not providing investors with enough reliable data about human rights and other social issues to allow accurate assessment of risks.

Representatives from CalPERS and Cbus Super joined academics in challenging large investors to do more for sustainable finance and outlining some practical ways to achieve this goal.


Top1000funds.com is the market leading news and analysis site for the world’s largest institutional investors. It focuses on leading the global investment industry to continuous improvement through case studies of best practice in governance and decision making, portfolio construction and efficient portfolio management, fees and costs, and sustainable investing.
The publication pushes the industry to question whether status quo processes and behaviours to tackle risks and opportunities will be sufficient in the future, and actively campaigns for diversity, sustainability, transparency, innovation and better alignment of fees in the investment industry.
Top1000funds.com is read by investment professionals in more than 40 countries.