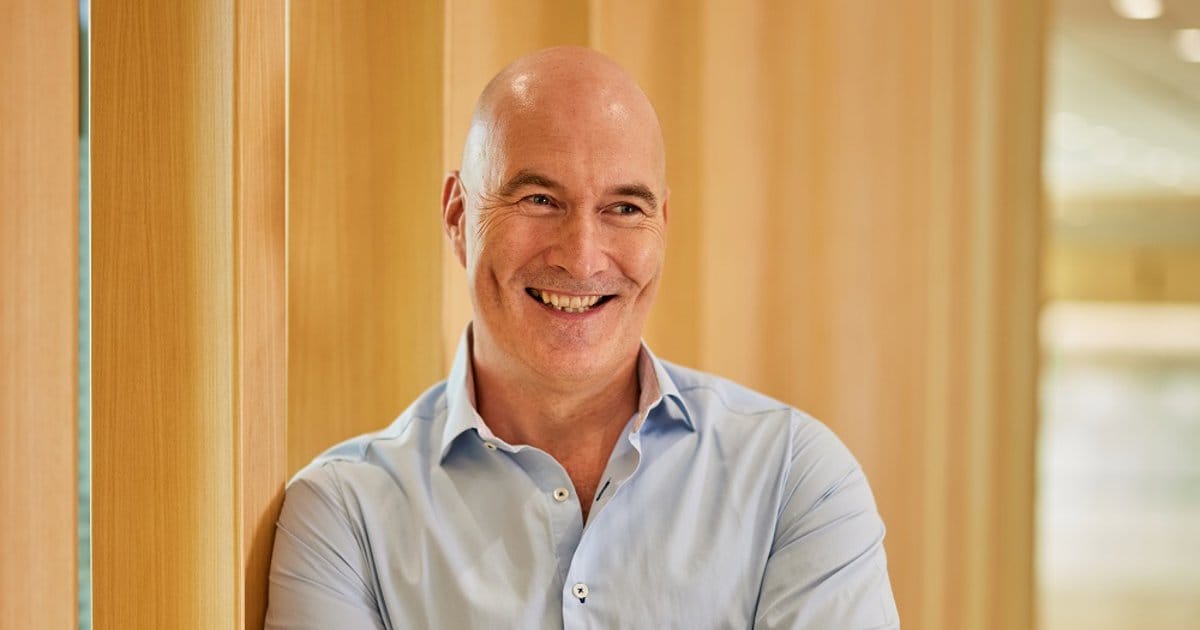
While some funds move towards more defensive allocations, executive director of the San Francisco Employees Retirement System, Gary Amelio (pictured), says the fund will maintain its belief in equities as it embarks on its five-year asset liability study.
 The San Francisco Employees Retirement System has always had a reasonably aggressive investment strategy, with almost half of the fund in public equities (26 per cent of which were domestic equities) at the beginning of the year, private equities comprising another 12 per cent, and real estate a little less than 10 per cent.
Throughout the recent financial crisis this did not change, and post the crisis it is not going to change either.
“We’ve done the analysis on our strategic asset allocation and decided nothing major needs to happen as a result,” executive director of the fund, Amelio says. Although he adds there is a shift to increase international equities and global fixed-income (probably out of real estate).
“We are following the same guidelines and believe there is no reason to do anything dramatic. We believe in equities, when some funds have moved away from those allocations. We don’t believe in investing your way out.”
During 2007-08 the average size of the fund was around $16.5 billion, the market decline took it down to $11 billion in early 2009 and that has been steadily increasing to its position of about $15.2 billion in assets now.
“Our assets have come back and I attribute that to a very solid investment policy which has been held to. We didn’t do anything reactionary, we watched the asset allocation, stayed with a long-term focus. So we didn’t ‘lose’ anything because we didn’t sell anything during that time,” he says.
SFERS has a long history, with parts of the fund dating back to 1850 (the Police Widows Fund), and in its current form it’s been around since 1924.
Amelio attributes a lot of the fund’s success, measured in longevity and funded status, to the city and county of San Francisco never failing to make an employer contribution.
“It’s the single most prominent reason for maintaining our funding status,” he says. “We’ve had an aggressive strategy and a prudent and stable investment policy. But the contribution levels are set by the voters of San Francisco, not boards or consultants. The benefits are modest and employee contributions healthy, there is a high level of transparency.”
The fund’s actuarial rate of return is 7.75 per cent and Amelio says a representation of the forward-thinking of the board is that it “went to less than 8 per cent long before the pension industry started talking about it”.
“The SFERS retirement board commissioners are knowledgeable about investments, incredibly well-informed and have maintained an educated, aggressive strategy for a long period of time.”
One of the few changes Amelio plans over the long-term, is to build up and out the investment team, with a number of senior hires to come.
The fund manages an allocation of 8.71 per cent in an S&P500 fund, and 3.7 per cent fixed income internally, under the leadership of deputy director for investments (chief investment officer), David Kushner.
“We have had new job descriptions written up and through the public process, it’s time-consuming but if you spend the time and do it right it is beneficial.”
The hiring of two managing directors, in public and private markets, and five underlying positions, in real estate, and private equity will bring the internal team to 14.
“The internal team’s function includes monitoring current manager performance, asset allocation guidelines and oversight of the current holdings of managers. In addition the staff co-ordinates the independent investment consultants and provides investment information to the board. They are also constantly on the lookout for new opportunities for appropriate fund investments. The fund does not invest in hedge funds and there is no current plan to modify that position.”
Long-term strategic asset allocation
| Asset Class | Policy Range % | |
| US equity | 22-30 | |
| International equity | 20-26 | |
| Fixed income | 20-35 | |
| Alternative assets | 10-18 | |
| Real estate | 9-15 | |
| Cash | 0- 1 |


